
Fig. 3.
- ID
- ZDB-IMAGE-210327-74
- Publication
- López-Cuevas et al., 2021 - Transformed notochordal cells trigger chronic wounds destabilizing the vertebral column and bone homeostasis
- All Figures
- Figures for López-Cuevas et al., 2021
|
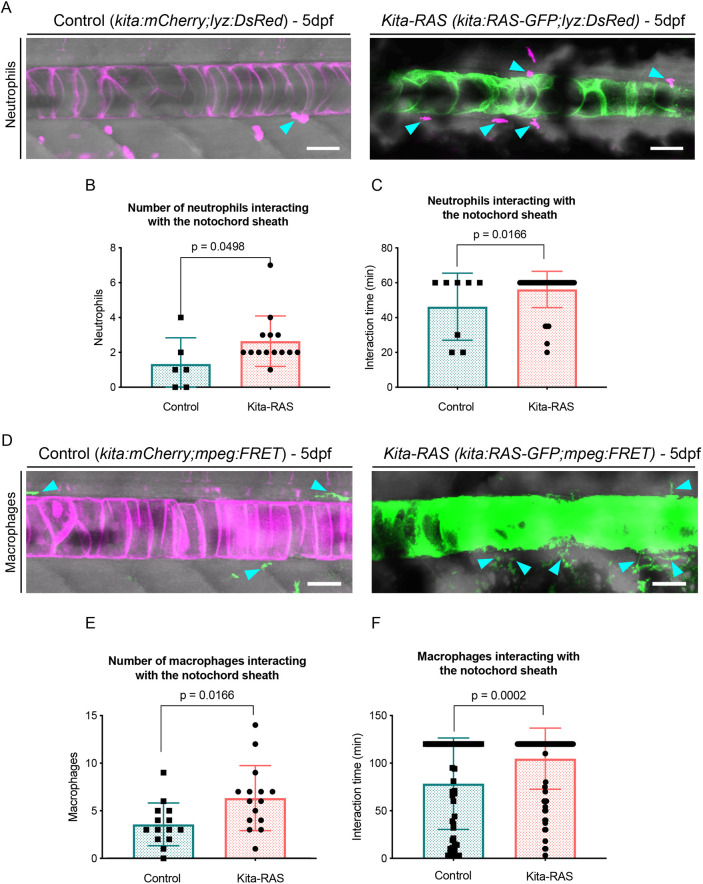
Fig. 3. Maximum projections from confocal images of the notochord at 5 dpf in control (kita-mCherry) and kita-RAS, showing neutrophils (cyan arrowheads) interacting by contact with the notochord sheath layer. (B) Numbers of neutrophils interacting with the notochord sheath during the time lapse (controls n=6 fish, kita-RAS n=14 fish). (C) Interaction time between neutrophils and the notochord sheath during the time-lapse movies. Each dot or square represents one neutrophil (controls n=8 neutrophils, n=4 fish; kita-RAS n=39 neutrophils, n=14 fish). (D) Maximum projections from confocal images of the notochord of 5 dpf control (kita-mCherry) and kita-RAS fish, showing macrophages (cyan arrowheads) interacting by contact with the notochord sheath. (E) Numbers of macrophages interacting with the notochord sheath during the time lapse (controls n=14 fish, kita-RAS n=15 fish). (F) Interaction time between macrophages and the notochord sheath during the time-lapse movies. Each dot or square represents one macrophage (controls n=51 macrophages, n=13 fish; kita-RAS n=95 macrophages, n=15 fish). Unpaired, nonparametric t-test and Mann–Whitney test were used for all charts. Data are mean±s.d.; P-values are indicated when significant (P<0.05). Scale bars: 50 µm.