- Title
-
Serum lipoprotein-derived fatty acids regulate hypoxia-inducible factor
- Authors
- Shao, W., Hwang, J., Liu, C., Mukhopadhyay, D., Zhao, S., Shen, M.C., Alpergin, E.S.S., Wolfgang, M.J., Farber, S.A., Espenshade, P.J.
- Source
- Full text @ J. Biol. Chem.
|
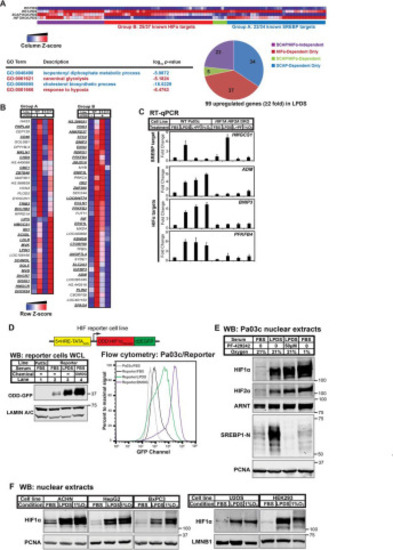
Figure 1. Lipoprotein depletion activates HIFα under normoxia. A, patient-derived human PDAC cell line Pa03c (WT), SCAP KO cells (S), and HIF1A HIF2A DKO cells (H) were cultured in FBS or LPDS for 16 h. Gene expression was determined using Illumina bead arrays. LPDS-induced genes (≥2-fold) were analyzed for GO term enrichment using GOrilla/REVIGO. GO terms related to the SREBP or HIF pathway are highlighted in blue or red, respectively. A clustered heatmap of LPDS-induced genes was generated by GenePattern 2.0. B, a clustered heatmap of 99 genes induced upon lipoprotein depletion (≥2-fold) was generated by GenePattern. Group A, induction in LPDS required SCAP, but not HIFα. Group B, induction in LPDS required HIFα, but not SCAP. Boldface, underlined genes are known transcriptional targets of SREBP or HIF in Group A or B, respectively. C, WT or HIF1A HIF2A DKO Pa03c cells were cultured for 16 h in FBS in the presence of DMSO (0.1%) under normoxic (FBS) or hypoxic (1% O2) conditions or in LPDS in the presence of DMSO (0.1%) (LPDS) or Site-1 protease inhibitor PF-429242 (50 μm) (L+PF) to inhibit SREBP. Gene expression for SREBP or HIF transcriptional targets measured by RT-qPCR was normalized to vehicle-treated Pa03c cells cultured in FBS. Error bars, S.E. of -fold changes from three biological replicates (mean ± S.E.). D, diagram of HIF reporter cell line that is a Pa03c clone stably expressing HIF1α ODD-d2EGFP under the control of five tandem HREs. Shown are immunoblots (WB) of whole-cell lysates or flow cytometry analysis from parental Pa03c cells cultured for 24 h in FBS and HIF reporter cells cultured for 24 h in FBS, LPDS, or FBS with DMOG (1 mm), a cell-permeable prolyl-4-hydroxylase inhibitor. E, immunoblots of nuclear extracts from Pa03c cells cultured for 16 h in FBS in the presence of DMSO (0.1%) under normoxic or hypoxic (1% O2) conditions or in LPDS in the presence of DMSO (0.1%) or site-1 protease inhibitor PF-429242 (50 μm) to inhibit SREBP. PCNA served as a loading control. F, immunoblots of nuclear extracts from the indicated cell lines cultured for 16 h in FBS, LPDS, or FBS in 1% O2. PCNA or LMNB1 served as a loading control. ACHN, renal cell adenocarcinoma; HepG2, hepatocellular carcinoma; BxPC3, pancreatic adenocarcinoma; U2OS, osteosarcoma; HEK293, embryonic kidney. |
|
Figure 2. Low-density lipoprotein regulates HIFα. A, immunoblots (WB) of nuclear extracts from Pa03c cells cultured for 16 h in FBS or LPDS supplemented with bovine lipoproteins (LPP; 0–1 mg/ml). PCNA served as a loading control. B, Pa03c cells were cultured for 16 h in FBS or LPDS with the indicated lipoprotein additions: human VLDL (0.2 mg/ml), human LDL (1 mg/ml), and human HDL (0.5 mg/ml). HIF1α immunoblot signal was normalized first to the loading control HDAC1 and then normalized to that in LPDS (n = 5, mean ± S.E. (error bars)). p values from a single-column t test (LPDS versus LPDS + VLDL, LDL, or HDL) are shown; NS, not significant; *, p < 0.05; **, p < 0.005. C, flow cytometry analysis of HIF reporter cells cultured for 24 h in FBS, LPDS, or LPDS supplemented with 0.5 or 1.5 mg/ml human LDL. D, immunoblots of whole-cell lysates from HIF reporter cells cultured for 24 h in FBS, LPDS, or LPDS with the indicated concentrations of human LDL. CALNEXIN served as a loading control. |
|
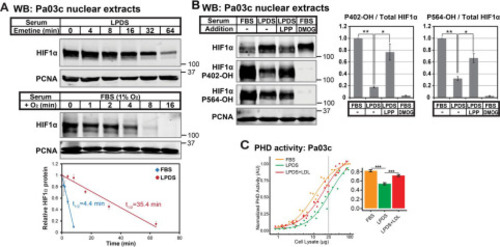
Figure 3. Lipoproteins regulate HIFα stability by controlling HIFα prolyl hydroxylation. A, immunoblots (WB) of nuclear extracts from Pa03c cells cultured in LPDS for 16 h prior to treatment with the translation inhibitor emetine (25 μm) for the indicated time (top) or Pa03c cells cultured in FBS at 1% O2 for 4 h and then shifted to normoxia for the indicated time (bottom). HIF1α was normalized to PCNA signal and plotted relative to the t = 0 time point. Linear regression curves were used to calculate HIF1α t½ (n = 3, mean ± S.E. (error bars)). B, immunoblots of nuclear extracts from Pa03c cells cultured for 14 h in FBS or LPDS with the following additions: bovine lipoproteins (LPP; 1 mg/ml) or the PHD inhibitor DMOG (1 mm), followed by the addition of MG132 (10 μm) to all conditions for an additional 2 h. HIF1α signal was normalized to PCNA, and the level of hydroxylated HIF1α relative to total was normalized to that in FBS (n = 3, mean ± S.E.). p values from a single-column t test (LPDS versus FBS) or Student's t test (paired, LPDS + LPP versus LPDS) are shown; *, p < 0.05; **, p < 0.005. C, PHD activity assay of cell lysates from Pa03c cells cultured in FBS, LPDS, or LPDS with human low-density lipoprotein (1 mg/ml) for 16 h. Four-parameter log logistic models were fit to data obtained from at least three independent experiments. A bar plot shows the calculated PHD activities from the curves at 25 µg. ***, p < 0.0005; Student's t test. |
|
Figure 4. LDL regulation of HIFα requires mitochondria. A, immunoblots (WB) of whole-cell lysates from HIF reporter cells cultured for 24 h in LPDS, LPDS with LDL (1 mg/ml), or LPDS with LDL (1 mg/ml) at 1% O2 with the indicated antioxidants: ascorbate (Ascor; 25 μm), ebselen (Eb; 25 μm), PDTC (20 μm), or 4,4′-diisothiocyanostilbene-2,2′-disulfonic acid (DIDS; 15 μm). LAMIN A/C served as a loading control. B, immunoblots of whole-cell lysates from HIF reporter cells cultured for 24 h in LPDS, LPDS with LDL (1 mg/ml), or LPDS with LDL (1 mg/ml) at 1% O2 with the indicated mitochondrial complex inhibitors (Complex-i): I (rotenone, 2 μm), II (malonate, 5 mm), III-A (antimycin, 10 μm), III-M (myxothiazol, 1 μm), or IV (oligomycin, 2 μm). LAMIN A/C serves as a loading control. C, immunoblots of whole-cell lysates from HIF reporter cells cultured for 24 h in LPDS with LDL (1 mg/ml); LPDS with mitochondrial-targeted chemical TPMP (1 μm) or antioxidant MitoQ (0.008–1 μm); or LPDS with LDL (1 mg/ml) plus the iron chelator (DFO; 100 μm) and mitochondrial-targeted antioxidant MitoQ (1 μm). LAMIN A/C served as a loading control. D, PHD activity assay of cell lysates from Pa03c cells cultured for 16 h in FBS, LPDS, or LPDS with mitochondrial-targeted chemical TPMP (1 μm) or antioxidant MitoQ (1 μm). Four-parameter log logistic models were fit to data obtained from at least three independent experiments. The bar plot shows the calculated PHD activities from the curves at 25 µg. ***, p < 0.0005, Student's t test. E, immunoblots of nuclear extracts from Pa03c cells or UQCRFS1 KO Pa03c cells cultured for 16 h in LPDS with LDL (1 mg/ml) or LPDS or FBS with DMOG (1 μm). LSD1 served as a loading control. F, succinate and fumarate levels in cell extracts measured by NMR from Pa03c cells cultured in FBS or LPDS for 16 h. NS, p > 0.05, Student's t test. Error bars, S.E. |
|
Download : Download high-res image (219KB)Download : Download full-size image Figure 5. LDL-derived fatty acids regulate HIFα. A, immunoblots (WB) of whole-cell lysates from HIF reporter cells cultured for 24 h in FBS with the indicated concentrations of lalistat 2, a specific LAL inhibitor. LAMIN A/C served as a loading control. B, flow cytometry analysis from HIF reporter cells cultured for 24 h in FBS, LPDS, or FBS with lalistat (25 μm) or U18666A (2 μm). C, Pa03c cells were cultured for 16 h in FBS, LPDS, or FBS with lalistat (25 μm) or U18666A (2 μm). Gene expression for SREBP or HIF transcriptional targets measured by RT-qPCR was normalized to vehicle-treated Pa03c cells cultured in FBS. Error bars, S.E. of -fold changes from three biological replicates (mean ± S.E.). D, PHD activity assay of cell lysates from Pa03c cells cultured in FBS, LPDS, or FBS with lalistat (25 μm) or U18666A (2 μm) for 16 h. Four-parameter log logistic models were fit to data obtained from at least three independent experiments. The bar plot shows the calculated PHD activities from the curves at 25 µg. ***, p < 0.0005, Student's t test. E, flow cytometry analysis from HIF reporter cells cultured for 24 h in FBS, LPDS, or LPDS supplemented with methyl-β-cyclodextrin complexed cholesterol (chol., 25 μm) or albumin-conjugated oleic acid (OA; 800 μm). F, immunoblots of nuclear extracts from WT Pa03c cells (n = 3) cultured for 16 h in FBS or LPDS in the absence or presence of water-soluble methyl-β-cyclodextrin-cholesterol complex (MβCD-chol) or in the presence of bovine lipoproteins (100 mg/dl). p values from a single-column t test (LPDS with MβCD-chol versus LPDS) are shown. ns, not significant; *, p < 0.05; **, p < 0.005. G, PHD activity assay of cell lysates from Pa03c cells cultured in FBS, in LPDS with fatty acid–free albumin (0.75%), or in fatty acid–free albumin–conjugated oleic acid (800 μm) for 16 h. Four-parameter log logistic models were fit to data obtained from at least three independent experiments. The bar plot shows the calculated PHD activities from the curves at 25 µg. ***, p < 0.0005; **, p < 0.005, Student's t test. |
|
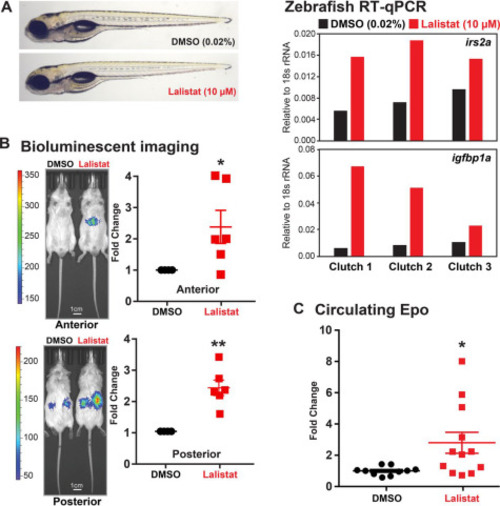
Figure 6. LAL inhibition activates HIFα in animals. A, representative images of WT zebrafish larvae (5 days postfertilization) treated with lalistat (10 μm) or vehicle control DMSO (0.02%) for 2 h are shown. Expression of HIFα targets irs2a and igfbp1a (relative to 18s rRNA, RNA pooled from five larvae) was analyzed using RT-qPCR. B, ODD-Luc mice received subcutaneous injection of either DMSO or lalistat (20 mg/kg) three times per week for 2 weeks. Shown are representative bioluminescent images (captured 2 min after luciferin injection) of ODD-Luc mice treated as indicated. Bioluminescent signals from lalistat-treated mice were normalized to vehicle control (n = 6, mean ± S.E. (error bars)). p values from a single-column t test (Lalistat versus DMSO) are shown: *, p < 0.05; **, p < 0.005. C, circulating Epo levels from lalistat-treated mice (n = 12, mean ± S.E.) were normalized to vehicle control (n = 10, mean ± S.E.). p values from a single-column t test (lalistat versus DMSO) are shown: *, p < 0.05. |
|
Figure 7. Model for lipoprotein regulation of HIF and SREBP. Left, lipoproteins are directed to lysosomes through receptor-mediated endocytosis, where free cholesterol and fatty acids are released by LAL-catalyzed hydrolysis. Released cholesterol blocks SREBP activation, and fatty acids prevent ROS production from mitochondria. PHD remains active and hydroxylates prolyl residues on HIFα, which leads to its rapid degradation. Middle, in the absence of lipoproteins, cells are deprived of cholesterol and fatty acids, resulting in SREBP activation and mitochondrial stress. Mitochondrial-ROS production increases, thereby inactivating PHD and stabilizing HIFα. Right, upon LAL inhibition, cholesterol and fatty acids from cholesteryl esters and triglycerides are unavailable. Decreased cholesterol supply activates SREBP, and decreased fatty acid supply results in mitochondrial stress. As with lipoprotein depletion, stressed mitochondria produce ROS, which inactivates PHD and stabilizes HIFα. Organelles are not to scale. |


