
|
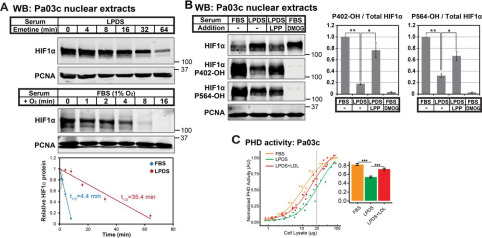
Fig. 3 Figure 3. Lipoproteins regulate HIFα stability by controlling HIFα prolyl hydroxylation. A, immunoblots (WB) of nuclear extracts from Pa03c cells cultured in LPDS for 16 h prior to treatment with the translation inhibitor emetine (25 μm) for the indicated time (top) or Pa03c cells cultured in FBS at 1% O2 for 4 h and then shifted to normoxia for the indicated time (bottom). HIF1α was normalized to PCNA signal and plotted relative to the t = 0 time point. Linear regression curves were used to calculate HIF1α t½ (n = 3, mean ± S.E. (error bars)). B, immunoblots of nuclear extracts from Pa03c cells cultured for 14 h in FBS or LPDS with the following additions: bovine lipoproteins (LPP; 1 mg/ml) or the PHD inhibitor DMOG (1 mm), followed by the addition of MG132 (10 μm) to all conditions for an additional 2 h. HIF1α signal was normalized to PCNA, and the level of hydroxylated HIF1α relative to total was normalized to that in FBS (n = 3, mean ± S.E.). p values from a single-column t test (LPDS versus FBS) or Student's t test (paired, LPDS + LPP versus LPDS) are shown; *, p < 0.05; **, p < 0.005. C, PHD activity assay of cell lysates from Pa03c cells cultured in FBS, LPDS, or LPDS with human low-density lipoprotein (1 mg/ml) for 16 h. Four-parameter log logistic models were fit to data obtained from at least three independent experiments. A bar plot shows the calculated PHD activities from the curves at 25 µg. ***, p < 0.0005; Student's t test.