FIGURE SUMMARY
Title

Expression of a Barhl1a reporter in subsets of retinal ganglion cells and commissural neurons of the developing zebrafish brain

Authors
Albadri, S., Armant, O., Aljand-Geschwill, T., Del Bene, F., Carl, M., Strähle, U., Poggi, L.
Source
Full text @ Sci. Rep.

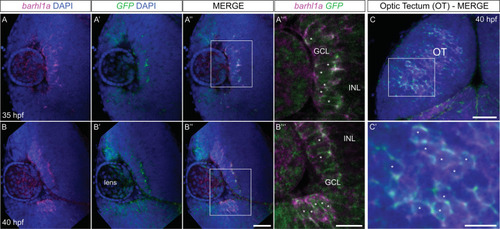
Expression of endogenous
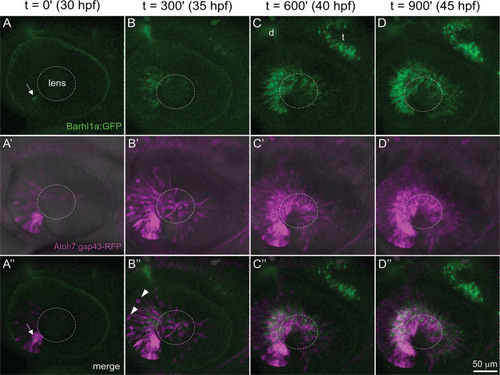
 barhl1a is reflected by barhl1a:GFP in the retina and brain. (A–B”’) Confocal optical section in frontal view (dorsal is to the top) through the retina of a 35 hpf (A - A’’’) and 40 hpf (B - B’’’) embryo after FISH against endogenous barhl1a (A, B in magenta) and the GFP transgene (A’, B’ in green). Retinae are counterstained with DAPI (blue). (A”, B”) merging of the two channels shows co-localization of the two transcripts in the GCL. (A”’, B”’) magnifications of (A”) and (B’’) (white squares), respectively, without the DAPI channel. (C-C’) Confocal imaging into the tectum of a 40 hpf embryo after FISH and DAPI conterstaining shows co-localization of barhl1a with GFP. Images represent a Z-stack in dorsal view (anterior is to the top) into the optic tectum (OT). (C’) magnification of (C) (white square). Asterisks highlight regions with colocalizing signals. GCL: ganglion cell layer, INL: inner nuclear layer, OT: optic tectum. Scale bars: (A-A”, B-B”, C) 50 µm, (A’’’, B’’’, C’) 20 µm.

Tg(barhl1a:GFP) labels new-born RGCs. (AD) Spatial-temporal distribution of Tg(barhl1a:GFP) expression in three different retinal developmental stages at 30 (A), 32 (B), 34 (C) and 36 (D) hpf. The GFP signal (green) becomes first evident at ~30 hpf in the ventral retina (white arrow in A) and subsequently follows the spatio-temporal wave of RGC differentiation. All images represent 1 µm Z-stacks in lateral view. (EG’) Single 1 µm optical slice (Z-stack) of a 33 hpf Tg(barhl1a:GFP) embryo immunolabeled with anti-Cxcr4b (magenta) and anti-GFP (green) antibodies. (E) GFP is detected in cells located in the basal half of the neuroepithelium around the lens at 33 hpf. These are also labelled by Cxcr4b (magenta in F, G and zoomed insert G’), which mark post-mitotic RGCs and their precursors at the cell membrane. Asterisks in G’ highlight Cxcr4b-positive (GFP-negative) RGCs. All images represent lateral view, anterior is left, dorsal is top. Scale bars: 20 µm.

Time course of barhl1a:GFP;atoh7:gap43-RFP expression. Frames from a time-lapse movie in the retina of a Tg(barhl1a:GFP;atoh7:gap43-RFP) double transgenic embryo imaged from ~30 hpf to ~45 hpf. Each time-frame represents a projection of Z-stacks in lateral view. Anterior is to the left, dorsal is to the top. Time-points (t) are t = 0 minute (’) at 30 hpf (A-A”), t = 300’~35 hpf (B-B”), t = 600’~40 hpf (C-C”) and t = 900’~45 hpf (D-D”). The first GFP-positive cells (in green) can be detected at ~ 30 hpf (t = 0) in the anterior-ventral retina (white arrow in A, A’’), when the Atoh7:gap43-RFP signal (in magenta) has already spread across the nasal retina at this developmental stage. The wave of Barhl1a:GFP follows the wave of Atoh7:gap43-RFP across the dorsal and temporal retina (B–D”), always remaining confined to the basal half of the retinal neuroepithelium. White arrowheads in (B”) point at RFP-positive (GFP-negative) cells rounding up at the apical surface before mitotic division. Barhl1a:GFP expression can also be observed in the developing optic tectum (t, C) and diencephalon (d, C). The dotted circles highlight the position of the lens. Scale bar: 50 µm.

Barhl1a:GFP labels a population of new-born RGCs and their axons. (A, A’) Single optical slices (Z-stacks) extracted from a movie frame of a retina of a Tg(barhl1a:GFP;atoh7:gap43-RFP) embryo at ~35 and ~45 hpf, respectively, showing the distribution of Barhl1a:GFP (green) and Atoh7:gap43-RFP (magenta) cells across the basal-apical surface of the retinal neuroepithelium. For both images anterior is to the left, dorsal is to the top. The outline of the retina is shown in the gray channel. Asterisks highlight the GFP-negative (gap43-RFP -positive) cells whereas the arrowheads point at the GFP positive cells. (B) Quantification of the percentage of GFP-positive (GFP + ve) and GFP-negative (GFP-ve) cells performed at 50 hpf revealed that 54% of RGCs are expressing Barhl1a:GFP (1391 total counted cells from n = 7 retinae). (C-C”) A single optical slice (Z-stack) in frontal view (dorsal is top) through the retina of a 50 hpf, Tg(barhl1a:GFP;atoh7:gap43-RFP) embryo counterstained with DAPI (C”), anti-GFP (C, green) and the RGC marker anti-Zn5 (C’, magenta) to brightly label both Barhl1a:GFP and the GCL. Asterisks highlight Barhl1a:GFP-negative (gap43-RFP/Zn5 -positive) RGCs. (D-D”) Frontal view of a 3D reconstruction of the head of an Tg(barhl1a:GFP;atoh7:gap43-RFP) embryo at 50 hpf (dorsal is to the top). Atoh7:gap43-RFP labelled retina and optic nerve are shown in magenta. At this stage, Barhl1a-GFP cells (green) have fully differentiated and extended their axons out of the retina forming the optic nerve. The optic nerves cross contra-laterally to form the optic chiasm (white arrowhead, D’) and reach their targets in the brain. The embryo has been counterstained with DAPI as shown in gray in (D). ONL, outer nuclear layer; INL, inner nuclear layer; GCL, ganglion cell layer. Scale bars: (A-A’) 20 µm, (C-C”) 20 µm, (D-D”) 50 µm.

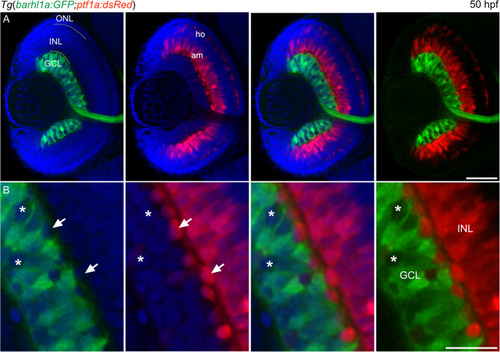
Barhl1a and Ptf1a reporter expressions are mutually exclusive. (A–B) Confocal imaging through the retina of a 50 hpf Tg(barhl1a:GFP;ptf1a:dsRed) embryo fixed and counterstained with DAPI (blue). Each image represents a single Z-stack in frontal view. Anterior is to the top. (B) always represents a higher magnification of (A). GFP-positive (green) cells are detected in the GCL whilst DsRed-positive cells (red) are detected in the amacrine (am) cells and horizontal (ho) cells of the inner nuclear layer (INL). White arrows point at DsRed-positive amacrine cells displaced in the GCL; which are always GFP-negative. Asterisks highlight the GFP-negative cells in the GCL; which are also DsRed-negative (B). GCL, ganglion cell layer; INL, inner nuclear layer; ONL, outer nuclear layer; am, amacrine cells; ho, horizontal cells. Scale bars: (A) 50 µm, (B) 20 µm.

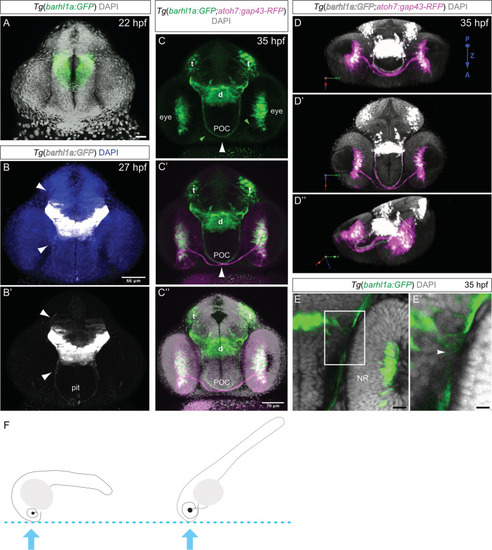
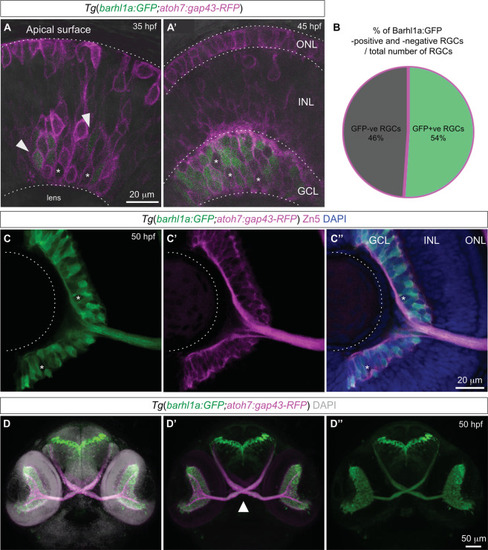
Developmental dynamic of Barhl1a:GFP cells in the diencephalon. Images represent projections of Z-stack (A–C”, E, E’) and 3D reconstructions (D–D”) of the anterior brain of fixed embryos at 22 (A), 27 (B-B’) and 35 hpf (C-C”, D-D” and E-E’) counterstained with DAPI. Images are in frontal view, dorsal is to the top. (A) Frontal view of the anterior brain of a Tg(barhl1a:GFP) transgenic embryo at 22 hpf showing Barhl1a:GFP (in green) in the presumptive diencephalon. DAPI staining is shown in gray. (B-B’) Frontal view of a Tg(barhl1a:GFP) transgenic embryo at 27 hpf. DAPI in (B) is shown in blue. White arrowheads point at Barhl1a:GFP projections (in gray) that extend and cross the midline ventrally and dorsally, respectively. The fibers that cross ventrally form a bundle of fibers along the presumptive optic tract. At this stage, few GFP-positive cells likely corresponding to pituitary cells can also be detected (pit, B’). (C-C”) Frontal view of an 35 hpf Tg(barhl1a:GFP;atoh7:gap43-RFP) double transgenic embryo. DAPI staining is shown in gray in C’. Barhl1a:GFP cells (in green) can be seen in tectal (t) and diencephalic (d) domains as well as in the eye. Bundles of Barhl1a:GFP fibers can be clearly seen crossing the ventral midline along the post optic commissure (POC). At this stage, the Atoh7:gap43-RFP positive RGCs (magenta) extend their axons out of the retina to form the optic nerve. The optic nerves cross contralaterally at the optic chiasm (white arrowhead) in close proximity to the diencephalic GFP-positive fibers forming the POC. The green arrowheads in (C) point at the few Barhl1a:GFP RGC fibers (in green), which are contained within the big bundle of magenta RGC fibers shown in C’ and C”. (D-D”) 3D reconstruction and turnaround of the anterior head region of a double transgenic Tg(barhl1a:GFP;atoh7:gap43-RFP) embryo at 35 hpf highlighting the optic nerves (in magenta) alongside the Barhl1a:GFP fibers (in gray). DAPI staining is in gray. In all three panels the view is from the posterior side of the stack/embryo; P, posterior; A, anterior; Z, z-axis. (E-E’) Enlarged confocal image (E) and its magnification (E’) of a frontal view of an Tg(barhl1a:GFP) transgenic embryo highlighting the fibers originating from Barhl1a:GFP cells located in the diencephalon (arrowheads). (F) Schematic cartoons showing approximate embryo orientation and plane of confocal imaging. Pit, pituitary. Scale bars: (A) 28 µm, (B-B’) 66 µm, (C-C”) 70 µm, (E) 20 µm, (E’) 50 µm.

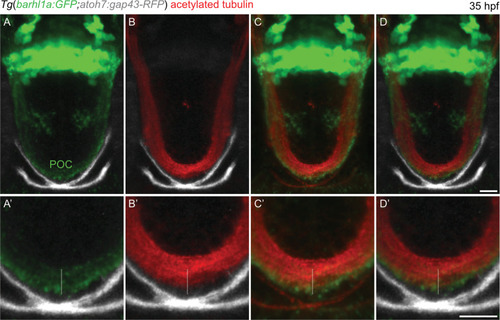
Barhl1a:GFP fibers co-localize with the neuronal projection marker acetylated Tubulin, a marker for the POC. (AD) single optical sections (Z-stacks) through the anterior brain of a 35 hpf, Tg(barhl1a:GFP;atoh7:gap43-RFP) embryos immunostained with acetylated-Tubulin labelling the POC and its fibers (in red). Frontal view, dorsal is to the top. Barhl1a:GFP cells and their projections are shown in green whilst the optic nerves labelled by Atoh7:gap43-RFP are shown in gray. The optic nerves from each eye cross at the optic chiasm site, ventral and anterior to the POC, to then proceed along the optic tract. (A’D’) higher magnification scan through the POC of the same embryo reveals partial overlap of the acetylated-Tubulin-labelled POC (highlighted by the white dashed line) and the Barhl1a:GFP fibers. Scale bars: (A–D) 50 µm, (A’–D’) 20 µm.

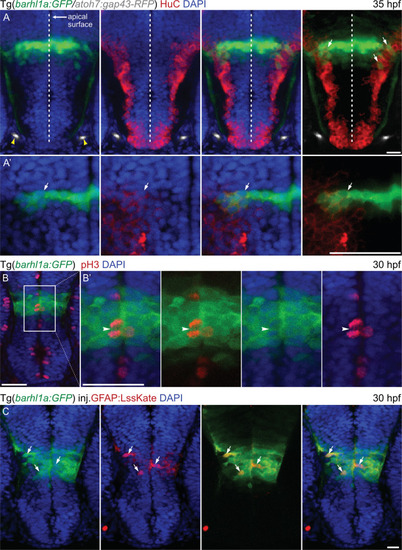
Barhl1a:GFP in the preoptic diencephalon marks populations of mitotic progenitors and differentiating neurons. Images represent single confocal Z-stacks through the diencephalon of Tg(barhl1a:GFP;atoh7:gap43-RFP) embryos at 35 hpf (A, A’) and 30 hpf (B, C). Frontal view, dorsal is up. Embryos in (A-B’) have been immunohistochemically stained with anti-GFP, anti-HuC (A, A’) and anti-pH3 (B, B’) antibodies (in red) as well as counterstained with DAPI (in blue). (A’) magnifications of the images in (A) in correspondence with the barhl1a:GFP expressing cell bodies. (A) yellow arrowheads point at the optic nerves from each side marked by Atoh7:gap43-RFP (in gray). White arrows point at Barhl1a:GFP cells co-labelled with HuC, a marker of differentiating neurons located in the basal half of the neuroepithelium. In (B) and its magnification (B’), Barhl1a:GFP cells are also co-labelled by pH3, which marks mitotic neurons located at the apical surface of the neuroepithelium (white arrowhead in B’). (C) 30 hpf Tg(barhl1a:GFP) embryo injected with the gfap:lssKate DNA construct shows sparse LssKate labelling in the diencephalon (in red); which co-localize with GFP (green). Scale bars: (A–C) 50 µm, (A’,B’) 20 µm.

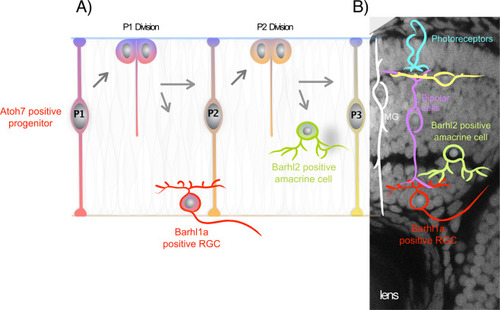
Hypothetical scenario describing Barhl1a RGCs and Barhl2 amacrine cells as clonally related retinal cells forming specific synapses. In this hypothetical model, (A) an asymmetric self-renewing division of an atoh7-expressing RGC progenitor gives rise to one Barhl1a-RGC and one Barhl2-amacrine cell sibling (see also20). (B) Cartoon representing the main retinal cell types organized into the three retinal nuclear layers; which are highlighted by the DAPI staining (in grey) of the retinal optical section from a 72 hpf embryo in the background. MG, Müller glial cells.

Acknowledgments
This image is the copyrighted work of the attributed author or publisher, and ZFIN has permission only to display this image to its users. Additional permissions should be obtained from the applicable author or publisher of the image. Full text @ Sci. Rep.