
- Title
-
Early cell-autonomous accumulation of neutral lipids during infection promotes mycobacterial growth
- Authors
- McClean, C.M., Tobin, D.M.
- Source
- Full text @ PLoS One

Neutral lipid accumulation is observed during in vivo infections using vital staining. a. Larvae were injected at 3 dpf into the tail fin. A bacterial suspension was deposited between epithelial layers of the tail fin as shown. b. Confocal imaging of the tail fin of infected Tg(mfap4:p2A-Turquoise2) larvae at 2 days post infection (dpi) with M. marinum (green) showing macrophage (turquoise) recruitment to site of infection. Bar = 100 μm. c. Confocal imaging of Tg(mfap4:p2A-Turquoise2) larvae 2 dpi with M. marinum (green) and following staining with Nile red. Arrows indicate location of neutral lipid accumulation within infected macrophages. Bar = 100 μm. d. Confocal imaging of Tg(mfap4:p2A-Turquoise2) larvae 2 dpi with M. marinum (green) and following staining with Nile red. Arrows indicate location of neutral lipid accumulation within infected macrophages. 60x objective, bar = 10 μm. e. Confocal imaging of a representative Tg(mfap4:p2A-Turquoise2) larva 2 dpi with M. marinum (green) and following staining with Nile red showing detail of Nile red staining pattern. 60x objective, bar = 20 μm. f. Confocal imaging of a representative Tg(mfap4:p2A-Turquoise2) larva 2 dpi with M. marinum (green) followed by staining with Nile red showing detail of Nile red staining pattern. 60x objective, scale bar = 20 μm. g. Representative images of uninfected and infected macrophages depicting the method of quantification of Nile red fluorescence intensity by first outlining all macrophages, then classifying uninfected (1) vs. infected (2) macrophages, and then measuring the integrated mean Nile red fluorescence of uninfected vs. infected macrophages. h. Integrated mean fluorescence and log-Integrated mean fluorescence of Nile red in uninfected vs. infected macrophages. Each data point represents the mean value of all macrophages within each class for a given animal. Data were collected from 13 individual animals. ***p = 0.0002 (Wilcoxon matched-paired sign rank test), ****p<0.0001 (paired t-test). |
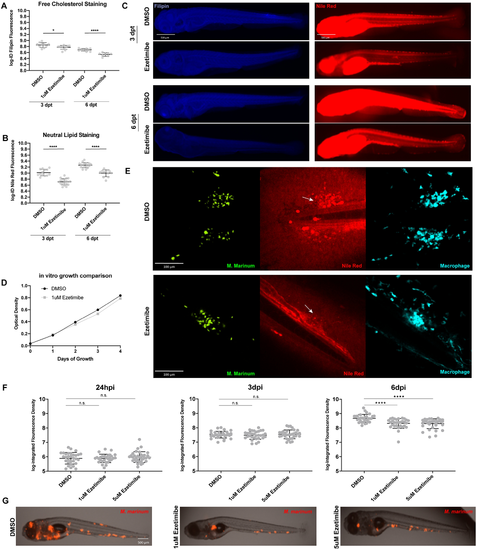
Ezetimibe treatment results in reduced neutral lipid accumulation and reduced infection burden. a. Comparison of integrated density of filipin fluorescence in the tail region of animals treated with vehicle alone (0.5% DMSO) or 1 μM ezetimibe. Data were collected at 3 and 6 days post-treatment (dpt). Student’s t-test *p = 0.018, ****p<0.0001 b. Comparison of integrated density of Nile red fluorescence in the tail region of animals treated with vehicle alone (0.5% DMSO) or 1 μM ezetimibe. Data were collected at 3 and 6 dpt. Student’s t-test ****p<0.0001 c. Animals representing the median values from comparison groups in (a) and (b). Bar = 500μm. d. Four-day time course of bacterial growth in vitro. Culture was maintained in either vehicle alone (0.5% DMSO) or 1 μM ezetimibe. No significant differences in bacterial growth were observed, Pearson R-squared = 0.99. e. Representative images of larval tail fins 2dpi in the absence or presence of ezetimibe treatment. Arrows indicate location of infection foci with (DMSO) or without (ezetimibe) neutral lipid accumulation. Bar = 100μm f. Comparison of infection burden at 24 hpi, 3 dpi, and 6 dpi in animals treated with vehicle alone (DMSO), 1 μM and 5 μM ezetimibe. No statistically significant differences were observed between groups at 24 hpi and 3dpi. One- way ANOVA with Tukey’s multiple comparisons ****p<0.0001. Representative of four independent experiments. g. Animals representing the median values from 6 dpi comparison groups in (f). |
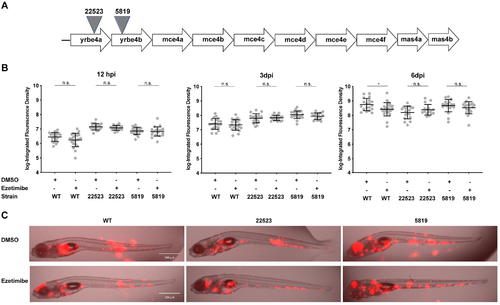
Mutations at the mce4 locus eliminate the effect of ezetimibe on infection burden. a. Schematic representation of mce4 locus showing location of transposon insertion mutants. b. Comparison of infection burden at 12hpi, 3dpi, and 6dpi in animals infected with wild-type, yrbe4aTn22523, or yrbe4bTn5819 and then treated with vehicle alone (DMSO) or 1 μM ezetimibe. Student’s t-test *p = 0.021. Representative of three independent experiments. c. Median animals from 6dpi comparison groups in (b). Bar = 500μm. |
|
a. Measurement of Nile red fluorescence in sorted cell populations. A 4.0-fold increase was observed in the geometric mean fluorescence intensity of Nile red staining between uninfected (red) and infected (cerulean) macrophages. B. Measurement of Nile red fluorescence in sorted cell populations. In an independent replicate, a 3.5-fold increase was observed in the geometric mean fluorescence intensity of Nile red staining between uninfected (red) and infected (cerulean) macrophages. |
|
a. Confocal imaging of a representative Tg(mfap4:p2A-Turquoise2) larva 2 dpi with M. marinum (green) and following staining with Nile red showing detail of Nile red staining pattern. 60x objective, bar = 20 μm. b. Confocal imaging of a representative Tg(mfap4:p2A-Turquoise2) larva 2 dpi with M. marinum (green) and following staining with Nile red showing detail of Nile red staining pattern. 60x objective, bar = 20 μm. c. Confocal imaging of a representative Tg(mfap4:p2A-Turquoise2) larva 2 dpi with M. marinum (green) and following staining with Nile red showing detail of Nile red staining pattern. 60x objective, scale bar = 20 μm. d. Confocal imaging of a representative Tg(mfap4:p2A-Turquoise2) larva 2dpi with M. marinum (green) and following staining with Nile Red showing detail of Nile red staining pattern. 60x objective, scale bar = 20 μm. |
|
a. Confocal imaging of tail fin of Tg(mfap4:p2A-Turquoise2) larvae 2 days post mock infection via injection of phenol red and staining with Nile red. Absence of Nile red stain accumulation. 20x objective, scale bar = 100 μm. |
|
a. Comparison of integrated mean fluorescence at the focus of infection in animals treated with vehicle alone (0.5% DMSO) or 1 μM ezetimibe in vehicle. The focus of infection was defined as the region of macrophage accumulation at the site of infection. The mean fluorescence of Nile red signal was determined by drawing a region around the macrophage accumulation and then measuring Nile red fluorescence signal within this region and calculating mean fluorescence. Animals treated with ezetimibe showed reduced accumulation of Nile red signal at the focus of infection by comparison of mean fluorescence by Student’s t-test, p = 0.0076. |
|
a. Comparison of infection burden at 12 hpi, 3 dpi, and 6 dpi in animals infected with wild-type, yrbe4aTn22523, or yrbe4bTn5819 and then treated with vehicle alone (DMSO) or 1 μM ezetimibe. Infection burdens at the initial timepoint showed no difference in burden at 12 hpi between wild-type, yrbe4aTn22523, or yrbe4bTn5819. By 3 dpi a burden difference was observed between wildtype and yrbe4aTn22523 (p<0.0001) but not between wildtype and yrbe4bTn5819. By 6dpi differences were observed between wildtype and both yrbe4aTn22523 and yrbe4bTn5819 (p<0.0001) all in untreated strains. Reduced burden is observed between ezetimibe-treated and untreated wildtype samples (p = 0.003). |