FIGURE SUMMARY
Title

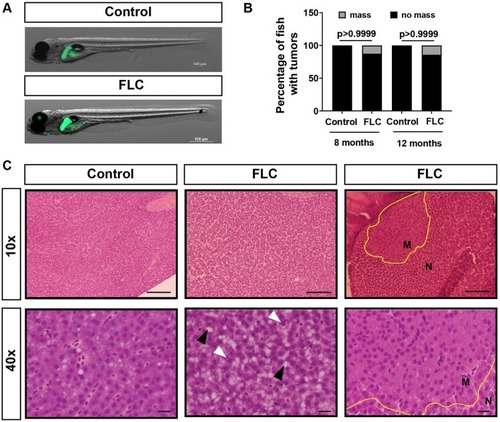
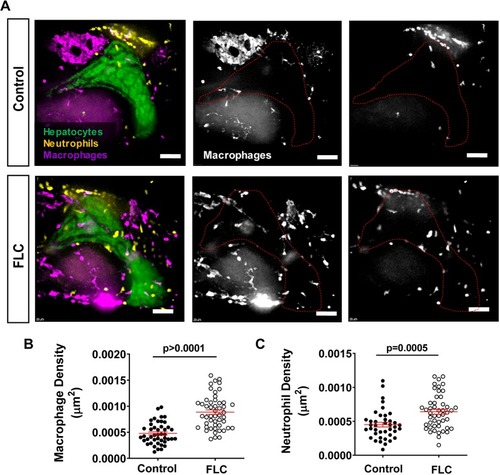
DnaJ-PKAc fusion induces liver inflammation in a zebrafish model of Fibrolamellar Carcinoma

Authors
de Oliveira, S., Houseright, R.A., Korte, B.G., Huttenlocher, A.
Source
Full text @ Dis. Model. Mech.

Overexpression of Dnajb1a-Prkacaa(zfDnaJa-Pkaca)can induce liver masses at adult stages. (A) Representative maximum-intensity projections (MIPs) of 7 day post-fertilization (dpf) FLC larvae [Tg(fabp10a:dnajb1a-prkacaa)/Tg(fabp10a:egfp-l10a)] and control siblings [Tg(fabp10a:egfp-l10a)]. (B) Chi-square graphs showing percentages of fish with masses (8 months, control N=5, FLC N=8; 12 months, control N=5, FLC N=7). (C) Representative images of H&E staining of the livers of 12-month-old fish at 10× and 40× magnification. Yellow outlines delineate masses, white arrowheads indicate prominent nucleoli and black arrowheads indicate lipid vacuoles. Scale bars: 60 μm (10× magnification) and 10 μm (40× magnification). M, mass; N, normal tissue.

Overexpression ofzfDnaJa-Pkacamodulates liver morphology. (A) Representative MIPs of 7 dpf FLC larvae [Tg(fabp10a:dnajb1a-prkacaa)/Tg(fabp10a:egfp-l10a)] and control siblings [Tg(fabp10a:egfp-l10a)]. Dotted red lines indicate liver area. (B,C) Graphs showing liver area (B) (control N=45, FLC N=53) and liver volume (C) (control N=22, FLC N=21). (D) Representative MIPs of 7 dpf FLC larvae [Tg(fabp10a:dnajb1a-prkacaa)/Tg(fabp10a:mCherry-kras)] and control siblings [Tg(fabp10a:mCherry-kras)]. Dashed red lines indicate hepatocyte area. (E-H) Graphs showing hepatocyte area (E,F) and diameter (G,H). In E and G, each dot represents one hepatocyte (control N=201, FLC N=261); in F and H, each dot represents one larva (control N=10, FLC N=13). Scale bars: 20 μm. Data are from at least three independent experiments. Analysis performed in EMM in R. Dot plots show mean±s.e.m.; P-values are shown on graphs.

Overexpression ofzfDnaJa-Pkacainduces liver inflammation. (A) Representative MIPs of 7 dpf FLC larvae [Tg(fabp10a:dnajb1a-prkacaa)/Tg(fabp10a:egfp-l10a)/Tg(lyzc:bfp)/Tg(mpeg1:mCherry-caax)] and control siblings [Tg(fabp10a:egfp-l10a)/Tg(lyzc:bfp)/Tg(mpeg1:mCherry-caax)]. Dotted red lines indicate liver area. (B,C) Graphs showing macrophage (B) (control N=44, FLC N=50) and neutrophil (C) (control N=40, FLC N=48) density in the liver area. Scale bars: 40 μm. Data are from at least three independent experiments. Analysis performed in EMM in R. Dot plots show mean±s.e.m.; P-values are shown on graphs.

FLC larvae show increased pro-inflammatory macrophages and increased caspase-a activityinthe liver area. (A) Representative MIPs of 7 dpf FLC larvae [Tg(fabp10a:dnajb1a-prkacaa_cryaa;Cerulean)/Tg(tnfa:egfp)/Tg(mpeg1:mCherry-caax)] and control siblings [Tg(tnfa:egfp)/Tg(mpeg1:mCherry-caax)]. Dotted red lines indicate liver area; red arrows indicate Tnfα-positive macrophages. (B) Graph showing ratio of Tnfα-positive macrophages to total macrophages in the liver area (control N=17, FLC N=19). (C) Representative MIPs of 7 dpf FLC larvae [Tg(fabp10a:dnajb1a-prkacaa_cryaa;Cerulean)] and control wild-type siblings. (D) Graph showing mean intensity fluorescent quantification in the liver area (control N=7, FLC N=16). Scale bars: 20 μm. Data are at least two independent experiments. Analysis performed in EMM in R. Dot plots show mean±s.e.m.; P-values are shown on graphs. a.u.f., arbitrary units of fluorescence.

Pharmacological inhibition of TNFα secretion and Caspase-a activity reduces inflammation and FLC progression. (A) Representative MIPs of 7 dpf FLC larvae [Tg(fabp10a:dnajb1a-prkacaa)/Tg(fabp10a:egfp-l10a)/Tg(lyzc:bfp)/Tg(mpeg1:mCherry-caax)] and control siblings [Tg(fabp10a:egfp-l10a)/Tg(lyzc:bfp)/Tg(mpeg1:mCherry-caax)] treated with 50 μM pentoxifylline (PTX), 50 μM metformin (MET) and 100 μM Ac-YVAD-CMK (C1INH). (B-D) Graphs showing liver area (B) (control N=32, PTX N=42, MET N=21, C1NH N=46), macrophage density (C) (control N=29, PTX N=42, MET N=19, C1NH N=42) and neutrophil density (D) (control N=32, PTX N=42, MET N=21, C1NH N=46). Scale bars: 40 μm. Data are from at least three independent experiments. Analysis performed in EMM in R. Dot plots show mean±s.e.m.; P-values are shown on graphs.

Acknowledgments
This image is the copyrighted work of the attributed author or publisher, and ZFIN has permission only to display this image to its users. Additional permissions should be obtained from the applicable author or publisher of the image. Full text @ Dis. Model. Mech.