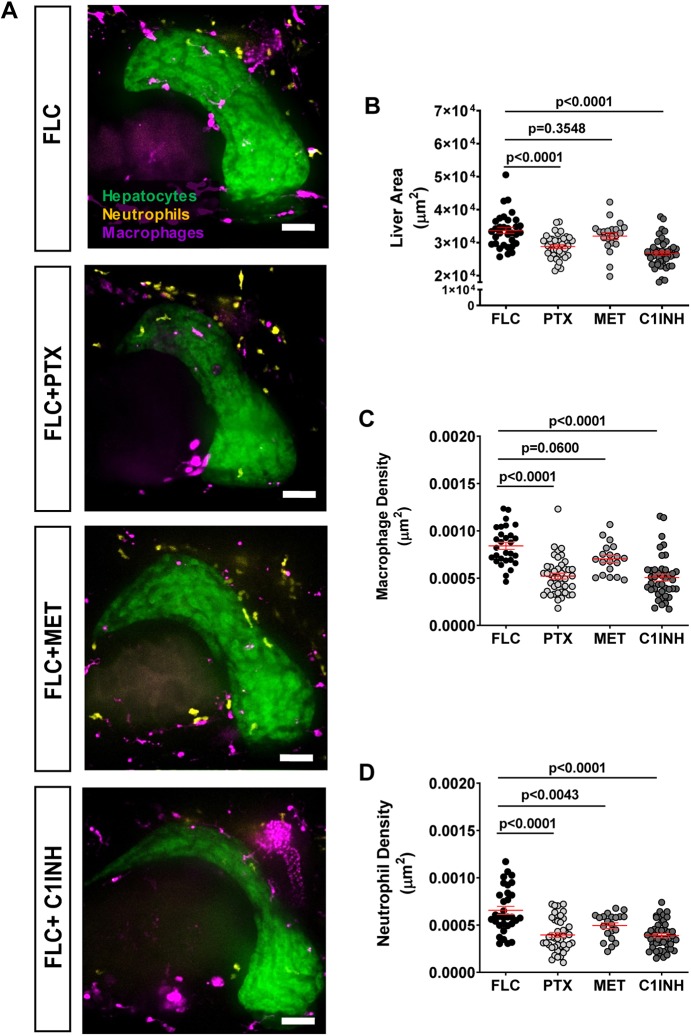
Pharmacological inhibition of TNFα secretion and Caspase-a activity reduces inflammation and FLC progression. (A) Representative MIPs of 7 dpf FLC larvae [Tg(fabp10a:dnajb1a-prkacaa)/Tg(fabp10a:egfp-l10a)/Tg(lyzc:bfp)/Tg(mpeg1:mCherry-caax)] and control siblings [Tg(fabp10a:egfp-l10a)/Tg(lyzc:bfp)/Tg(mpeg1:mCherry-caax)] treated with 50 μM pentoxifylline (PTX), 50 μM metformin (MET) and 100 μM Ac-YVAD-CMK (C1INH). (B-D) Graphs showing liver area (B) (control N=32, PTX N=42, MET N=21, C1NH N=46), macrophage density (C) (control N=29, PTX N=42, MET N=19, C1NH N=42) and neutrophil density (D) (control N=32, PTX N=42, MET N=21, C1NH N=46). Scale bars: 40 μm. Data are from at least three independent experiments. Analysis performed in EMM in R. Dot plots show mean±s.e.m.; P-values are shown on graphs.
This image is the copyrighted work of the attributed author or publisher, and
ZFIN has permission only to display this image to its users.
Additional permissions should be obtained from the applicable author or publisher of the image.
Full text @ Dis. Model. Mech.
Your Input Welcome
Thank you for submitting comments. Your input has been emailed to ZFIN curators who may contact you if
additional information is required.
Oops. Something went wrong. Please try again later.