
- Title
-
In Vivo Function of the Chaperonin TRiC in α-Actin Folding during Sarcomere Assembly
- Authors
- Berger, J., Berger, S., Li, M., Jacoby, A.S., Arner, A., Bavi, N., Stewart, A.G., Currie, P.D.
- Source
- Full text @ Cell Rep.
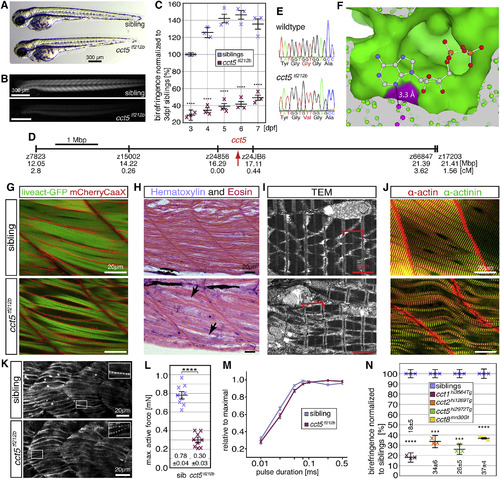
A Missense Mutation in cct5 Causes Muscle Impairment within cct5tf212b (A) At 3 dpf, cct5tf212b mutants appear similar to their siblings under bright-field conditions (n = 6 per genotype). (B) Representative images of 3-dpf-old cct5tf212b mutants under polarized light show a reduction in birefringence (quantified in C). (C) Quantification of birefringence followed by normalization to 3-dpf-old siblings revealed a highly significant reduction in cct5tf212b homozygotes through 7 dpf. Data are mean ± SEM; ∗∗∗∗p < 0.0001 homozygotes versus siblings of the same stage by one-way ANOVA with Tukey’s post hoc test; n = 3. (D) SSLP-based mapping linked the phenotype-causing mutation to cct5 on chromosome 24. SSLP positions are shown in centimorgans and million base pairs according to the zebrafish genome assembly. Scale bar, 1 Mbp. (E) Sequencing identified a missense mutation in exon 9 of cct5 (G422V). (F) G422 (pink) forms part of the ATP-binding pocket (surface representation, green) of human CCT5. The glycine carbon is only 3.3 Å away from the adenosine nitrogen (stick representation, blue). (G) Labeling of the sarcolemma with mCherryCaaX and the myofibril with Lifeact-GFP confirmed a reduced amount of myofibrils within cct5tf212b homozygotes (n = 4 per genotype). (H) H&E-stained sagittal sections of 6-dpf-old larvae confirmed the reduced amount of myofibrils in cct5tf212b; arrows mark enlarged regions of the sarcoplasm (n = 8 per genotype). (I) Representative transmission electron micrographs depicting organized sarcomeres, marked by brackets, in 3-dpf siblings and cct5tf212b mutants (n = 3 per genotype). (J) Immunohistochemistry with antibodies against actin (red) and α-Actinin (green) enabled quantification of the sarcomere width that was not altered in cct5tf212b (n = 3 per genotype). (K) At the 18-somite stage, regularly spaced actinin-positive Z-bodies indicate the presence of pre-myofibrils in siblings and cct5tf212b homozygotes (n = 4 per genotype). (L) Maximal force generation of cct5tf212b were significantly impaired compared with siblings. Data are mean ± SEM; ∗∗∗∗p < 0.0001 by Student’s t test; n = 9. (M) Pulse duration and active force relationships are similar in both groups, suggesting unchanged motor neuron excitation. Data are mean ± SEM; n = 10. (N) The insertion mutants cct1hi3564Tg, cct2hi1269Tg, cct5hi2972Tg, and cct8mn30Gt all feature a highly significant reduction in birefringence. Data are mean ± SEM; ∗∗∗p < 0.001 and ∗∗∗∗p < 0.0001 by Student’s t test; n = 3. See also Figures S1–S5. EXPRESSION / LABELING:
PHENOTYPE:
|
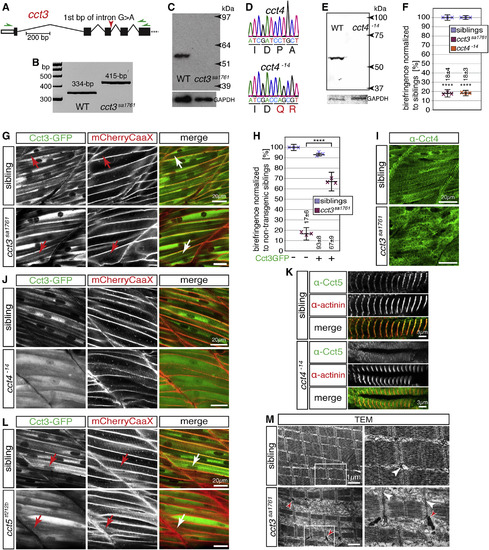
Loss of TRiC Subunits Causes Lack of Functional TRiC at Sarcomeric Z-disks (A) cct3sa1761 harbors an essential splice site mutation in cct3 (red arrow). (B) RT-PCR using oligonucleotides targeting regions marked by green arrows in (A) generated a 334-bp amplicon with WT embryos and a single 415-bp amplicon with cct3sa1761 homozygotes. Amplicons were identified by sequencing. (C) Western blot analysis using antibodies against human CCT3 revealed epitope loss in cct3sa1761 homozygotes (GAPDH served as a loading control). (D) CRISPR/Cas9-mediated deletion of 14 bp from exon 5 of cct4 causes a frameshift evoking premature stop codons in cct4−14. (E) Western blot analysis using antibodies against CCT4 revealed epitope loss in cct4−14 homozygotes (GAPDH served as a loading control). (F) At 3 dpf, the birefringence was significantly reduced in cct3sa1761 and cct4−14 mutants compared with siblings. Data are mean ± SEM; ∗∗∗∗p < 0.0001 by Student’s t test; n = 3. (G) GFP fluorescence of Tg(cry:mCherry,-600unc:cct3GFP) localized to sarcomeric Z-disks as identified by co-localization with mCherryCaaX-positive t-tubules introduced by Tg(acta1:mCherryCaaX) in siblings and cct3sa1761 homozygotes (arrows) (n = 5 per genotype). (H) Expression of the Cct3-GFP fusion protein ameliorated the birefringence of cct3sa1761 homozygotes with high significance. Data are mean ± SEM; ∗∗∗∗p < 0.0001 by one-way ANOVA with Tukey’s post hoc test; n = 3. (I) The striated pattern obtained with antibodies against Cct4 in siblings was severely compromised in cct3sa1761 (n = 5 per genotype). (J) Compared with siblings, localization of Cct3-GFP to Z-disks is severely compromised in cct4−14 homozygotes transgenic for Tg(cry:mCherry,-600unc:cct3GFP) and Tg(acta1:mCherryCaaX) (n = 4 per genotype). (K) Immunohistochemistry detected the localization of Cct5 at actinin-positive Z-disks in siblings but not in cct4−14 homozygotes (n = 3 per genotype). (L) In cct5tf212b homozygotes and siblings that harbor Tg(cry:mCherry,-600unc:cct3GFP) and Tg(acta1:mCherryCaaX), GFP-tagged Cct3 localized to Z-disks (arrows) (n = 3 per genotype). (M) Representative TEM micrographs of cct3sa1761 present a reduced amount of myofibrils (n = 3 per genotype). Importantly, although the sarcomeres appear organized, electron-dense rods were detected at Z-disks in cct3sa1761 (red arrowheads). White arrowheads point to t-tubules at Z-disks. Boxed areas are shown at higher magnification. See also Figures S4, S5, and S7. EXPRESSION / LABELING:
PHENOTYPE:
|
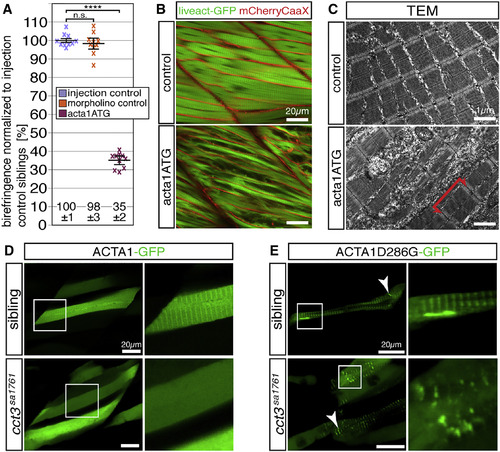
Actin Folding Is Impaired in cct3sa1761 (A) Injection of 3-dpf-old WT larvae with 100 μM acta1ATG morpholino targeting acta1a and acta1b significantly reduced their birefringence in comparison with larvae injected with injection solution (injection control) or 100 μM standard control morpholino (morpholino control). Data are mean ± SEM; ∗∗∗∗p < 0.0001 by Student’s t test; n = 10. (B) The reduced amount of myofibrils after acta1a and acta1b knockdown was also documented in the transgenic background of Tg(acta1:mCherryCaaX) and Tg(acta1:lifeact-GFP) (n = 4 per genotype). (C) TEM revealed that knockdown of acta1a and acta1b reduced the amount of myofibrils but did not affect sarcomere organization (n = 3 per genotype). (D) After incorporation of ACTA1-GFP, the myofibrils of siblings presented a striated fluorescence pattern, whereas the fluorescence of the cct3sa1761 myofibrils appeared uniform (4 larvae per genotype, each with 5 myofibers analyzed). (E) Mutant ACTA1D286G-GFP formed rod-shaped structures (arrowhead) in siblings, whereas, in cct3sa1761 homozygotes, exclusively amorphic aggregates of various sizes (arrowhead) were observed (4 larvae per genotype, each with 5 myofibers analyzed). See also Figure S6 and Table S1. EXPRESSION / LABELING:
PHENOTYPE:
|
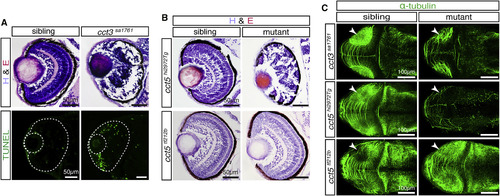
All cct Mutants Show Retina Degeneration, Except for cct5tf212b (A) H&E-stained sections of 3-dpf-old cct3sa1761 mutants showed severe retina degeneration (n = 11 per genotype) accompanied by abundant apoptosis detected by TUNEL assay (n = 6 per genotype). (B) At 3 dpf, retina degeneration was also apparent on H&E-stained sections of the insertion mutant cct5hi2972Tg but not of the missense mutant cct5tf212b (n = 11 per genotype). (C) Pursuant to the retina degeneration, immunohistochemistry with antibodies against acetylated α-tubulin detected neurite defects in the tectum (arrowheads) of cct3sa1761 and cct5hi2972Tg but not cct5tf212b homozygotes (n = 4 per genotype). See also Figure S6. EXPRESSION / LABELING:
PHENOTYPE:
|
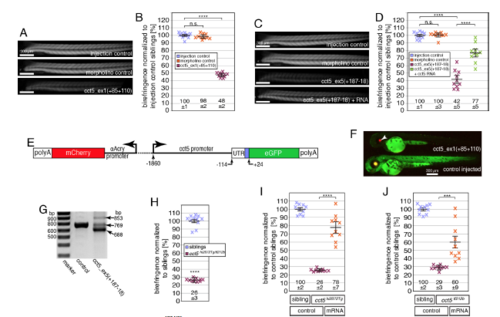
The phenotype of cct5tf212b is caused by a mutation within cct5. Related to Figure 1. (A, B) Administration of 100 μM standard control morpholino to 3-dpf-old larvae (morpholino control) did not reduce the birefringence in comparison to larvae that were treated with injection solution (injection control). However, a highly significant reduction in birefringence was detected with 3-dpf-old larvae treated with 100 μM of the translation-blocking morpholino cct5_ex1(+85+110). Data are mean ± SEM. ****p < 0.0001 by one-way ANOVA with Tukey’s post hoc test; n = 10. (C, D) Administration of 200 μM of the splice-altering morpholino cct5_ex5(+187-18) to 3-dpf-old larvae lead to a highly significant reduction in birefringence compared to control larvae that were injected with injection solution (injection control) or larvae that were treated with 200 μM standard control morpholino (morpholino control). Administration of 200 μM cct5_ex5(+187-18) together with 50 ng cct5 transcript significantly increased the birefringence compared to larvae that were injected only with 200 μM cct5_ex5(+187-18). Data are mean ± SEM. ****p < 0.0001 by one-way ANOVA with Tukey’s post hoc test; n = 10. (E) A schematic of the transgenic construct in Tg(cry:mCherry,-1.8cct5:GFP) shows that mCherry expression is controlled by the lens-specific αA-crystallin promoter and GFP is regulated by upstream region of cct5 ranging from -1860 to +24 bp relative to the start codon. (F) At 2 dpf, control injected Tg(cry:mCherry,-1.8cct5:GFP) showed a widespread GFP expression that was abolished in siblings treated with 100 μM cct5_ex1(+85+110); note residual control mCherry in the lens (arrowhead). Representatives of four analyzed larvae per genotype are shown (n = 4 per genotype). (G) Whereas RT-PCR performed with control 3-pdf-old larvae resulted in a 769-bp amplicon, RT-PCR with larvae injected with 200 μM cct5_ex5(+187-18) resulted in two additional amplicons: 688-bp corresponding to a deletion of 81-bp from exon 5 and 853-bp resulting from inclusion of the intron between exons 5 and 6. All amplicons were identified by sequencing. (H) cct5hi2972Tg/tf212b compound heterozygotes displayed a reduction in birefringence that was similar to single cct5hi2972Tg homozygotes. Data are mean ± SEM. ****p < 0.0001 by student’s t-test; n = 10. (I) Compared to control-injected cct5hi2972Tg homozygotes, administration of 25 ng cct5 transcript to cct5hi2972Tg homozygotes resulted in a highly significant increase in birefringence. Data are mean ± SEM; ****p < 0.0001 by one-way ANOVA with Tukey’s post hoc test; n = 10. (J) Administration of 50 ng cct5 transcript to cct5tf212b homozygotes resulted in a highly significant increase in birefringence compared to control-injected cct5tf212b homozygotes. Data are mean ± SEM. ***p < 0.001 by one-way ANOVA with Tukey’s post hoc test; n = 10. |
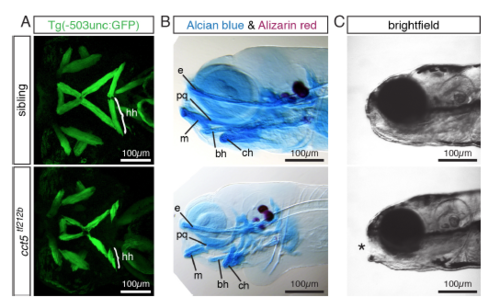
Affected head musculature and cartilage malformations in cct5tf212b. Related to Figure 1. (A-C) Representatives of five analyzed larvae per genotype are shown (n = 5 per genotype). (A) At 3 dpf, Z-stack projections of transgenic Tg(-503unc:GFP) larvae reveal that the hyohyoideus (hh) muscles were significantly shortened in cct5tf212b compared to their siblings. The length of the hyohyoideus muscles were 45 ± 2 μm within cct5tf212b homozygotes compared to 133 ± 3 μm within siblings (Data are mean ± SEM; p < 0.0001 by student’s t-test; n = 5). (B) Accordingly, Alcian blue and Alizarin red stained 6-dpf-old larvae showed cartilage malformations in cct5tf212b homozygotes but not in siblings. Label of pharyngeal cartilages: basihyal (bh); ceratohyal (ch); ethmoid plate (e); Meckel’s cartilage (m); palatoquadrate (pq). (C) In contrast to their 6-dpf-old siblings, cct5tf212b mutants did not close their mouth (marked by asterisk). |
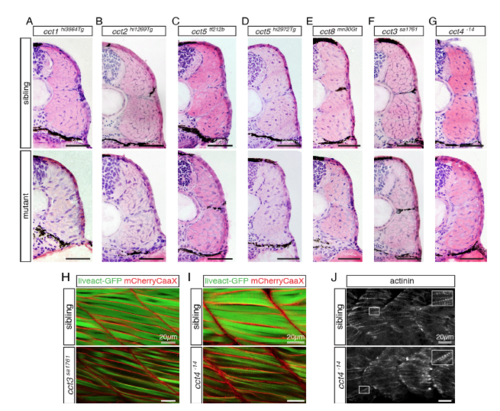
In skeletal muscle, mutations within cct genes can lead to enlarged regions of endomysial connective tissue with reduced amount of myofibril. Related to Figures 1 and 2. (A-G) Cross sections of 3-dpf-old larvae stained for H&E indicate enlarged regions of endomysial connective tissue in cct mutants compared to their siblings. Representatives of a minimum of 6 analyzed larvae per genotype are shown (n > 6 per genotype). (A) Homozygotes of gene trap mutant cct1hi3564Tg and siblings. (B) Homozygotes of gene trap mutant cct2hi1269Tg and siblings. (C) Homozygotes of the mutant cct5tf212b and siblings. (D) Homozygotes of gene trap mutant cct5hi2972Tg and siblings. (E) Homozygotes of gene trap mutant cct8mn30Gt and siblings. (F) Homozygotes of null mutant cct3sa1761 and siblings. (G) Homozygotes of null mutant cct4-14 and siblings. (H and I) Representatives of 4 analyzed larvae per genotype are shown (n = 4 per genotype). (H) The reduced amount of myofibril in cct3sa1761 mutants was confirmed in the transgenic background of Tg(acta1:mCherryCaaX) and Tg(acta1:liveact-GFP). (I) According to the reduced level of birefringence, a reduced amount of myofibril in cct4-14 was visualized by Tg(acta1:mCherryCaaX) and Tg(acta1:liveact-GFP). (J) Regularly spaced actinin-positive Z-bodies of pre-myofibril were detected in siblings as well as in cct4-14 homozygotes. |
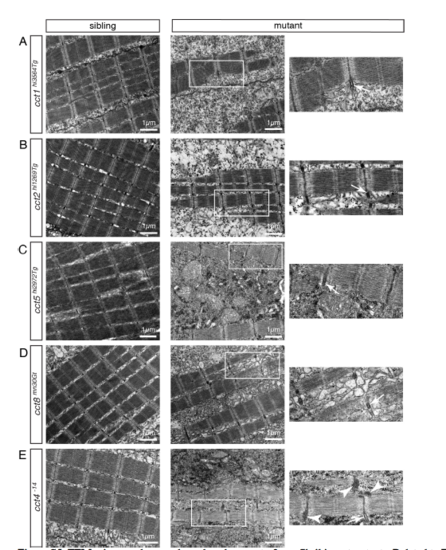
TEM micrographs reveal a reduced amount of myofibril in cct mutants. Related to Figures 1 and 2. (A-E) Sarcomere organization was preserved within all analyzed cct mutants as revealed by EM micrographs of 3-dpf-old larvae. Boxed areas within micrographs of cct mutants are magnified. Arrows point to Z-disk-associated t-tubules and arrowheads notify aggregates. Representatives of a minimum of 3 analyzed larvae per genotype are shown (n > 3 per genotype). (A) The structure of sarcomeres was preserved in cct1hi3564Tg, however the amount of myofibril was reduced in cct1hi3564Tg homozygotes. (B) The reduction in the amount of myofibril and the preserved sarcomere organization was also apparent on TEM micrographs of cct2hi1269Tg. (C) Also in cct5hi2972Tg mutants, sarcomere organization was preserved, but the amount of myofibril was reduced. (D) cct8mn30Gt mutants showed a similar myofibril reduction and unaffected sarcomere organization. (E) In cct4-14 homozygotes the amount of myofibril was reduced and electron-dense aggregates close to Zdisks were documented (arrowheads). |
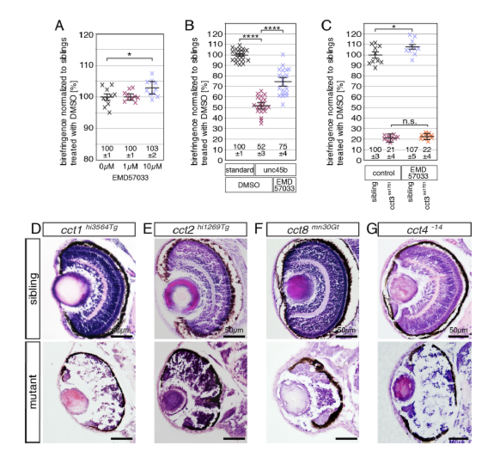
Sarcomeric defects within cct3sa1761 are not predominantly caused by deficiencies in myosin folding and retina degeneration characterizes cct1hi3564Tg, cct2hi1269Tg, cct8mn30Gt and cct4-14. Related to Figures 3 and 4. (A) Administration of 10 μM EMD57033, a small molecule that stabilizes and refolds myosin (Radke et al., 2014), significantly increased the birefringence of 3-dpf-old wildtype larvae compared to DMSOtreated control embryos. No significant effect was observed with 1 μM EMD57033 and administration of 100 μM EMD57033 was lethal. Data are mean ± SEM; *p < 0.05 by one-way ANOVA with Tukey’s post hoc test; n = 10. (B) Compared to 3-dpf-old wildtype larvae that were injected with 300 μM standard control morpholino and treated with the control vehicle DMSO at 1 dpf, administration of 300 μM unc45b morpholino and subsequent DMSO treatment led to a highly significant reduction in birefringence. Treatment of unc45b morphants with 10 μM EMD57033 at 1 dpf led to a highly significant amelioration of the birefringence compared to DMSO-treated unc45b morphants. Data are mean ± SEM; ****p < 0.0001 by one-way ANOVA with Tukey’s post hoc test; n = 20. (C) Administration of 10 μM EMD57033 did not significantly (n. s.) ameliorate the birefringence of cct3sa1761 homozygotes. Data are mean ± SEM; *p < 0.05 by one-way ANOVA with Tukey’s post hoc test; n = 10. (D-G) H&E-stained sections of 3-dpf-old larvae revealed retina degeneration in the following mutants. Representatives of a minimum of 6 analyzed larvae per genotype are shown (n > 6 per genotype). (D) Homozygotes of gene trap mutant cct1hi3564Tg. (E) Homozygotes of gene trap mutant cct2hi1269Tg. (F) Homozygotes of gene trap mutant cct8mn30Gt. (G) Homozygotes of null mutant cct4-14. |
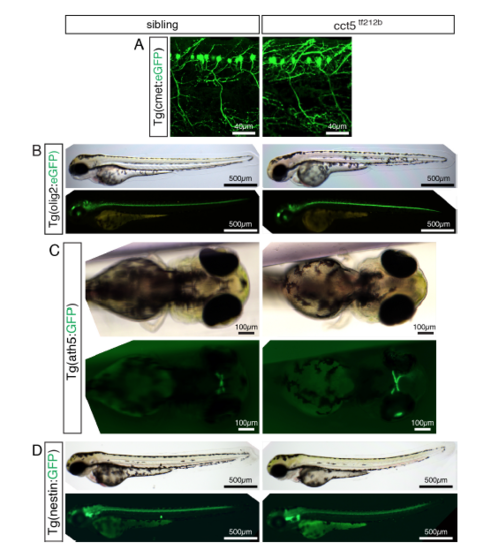
Transgenic marker lines do not reveal a neuronal phenotype within cct5tf212b. Related to Figure 2. (A-D) Representatives of a minimum of 3 analyzed larvae per genotype are shown (n > 3 per genotype). At 3 dpf, no marked phenotype was observed with the following transgenic lines labeling distinct neurons: (A) No marked phenotype of cct5tf212b was observed in the transgenic background of Tg(cmet:eGFP), a marker line for motor neurons (Hall et al., 2007). (B) Similarly, crossing cct5tf212b into the background of Tg(olig2:eGFP) did not reveal a marked phenotype in the oligodendrocytes of cct5tf212b (Shin et al., 2003), documented under bright field and fluorescence conditions. (C) Also crossing cct5tf212b to Tg(ath5:GFP), a marker line for retinal ganglion cells (Masai et al., 2003), did not reveal a neuronal phenotype. (D) Utilizing the Tg(nestin:GFP), which amongst others highlights the neuronal stem cell niche (Kaslin et al., 2009), did not result in a marked phenotype of cct5tf212b mutants. |