
- Title
-
Zebrafish skeleton development: High resolution micro-CT and FIB-SEM block surface serial imaging for phenotype identification
- Authors
- Silvent, J., Akiva, A., Brumfeld, V., Reznikov, N., Rechav, K., Yaniv, K., Addadi, L., Weiner, S.
- Source
- Full text @ PLoS One
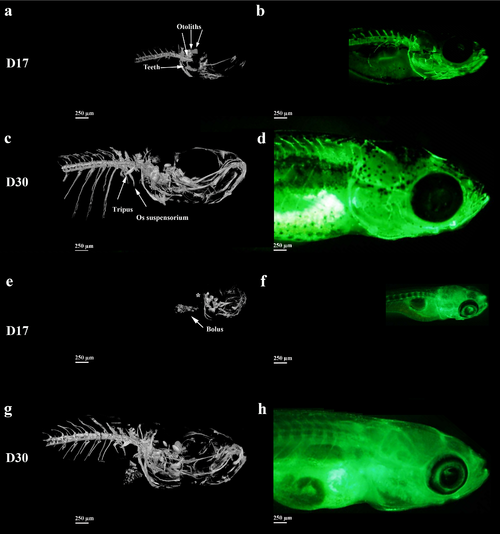
Micro-CT-scan and 3D-reconstructions (a,c,e,g) and fluorescence microscopy after calcein staining imaging (b,d,f,h) of side views of calcified skeletal structures in wild type (a,b,c,d) and nacre (e,f,g,h) zebrafish larvae at 17 dpf (a, b, e, f) and 30 dpf (c,d,g,h). No vertebra is observed using the CT scan observation at D17 (asterisk). PHENOTYPE:
|
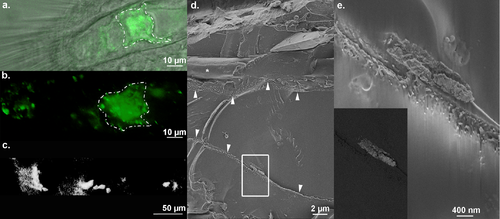
Tail area showing the unknown deposit revealed by calcein staining using confocal microscopy, micro-CT and cryo-SEM, observed in nacre zebrafish at 14 dpf. (a,b) Distal region of the body observed in top view using confocal microscopy reveals a positive staining localized in the nucleus pulposus cells (white dotted line). (c) In lateral view using micro-CT, we show that this positive staining is due to dense material. d,e. InLens secondary electron images using cryo-SEM in a longitudinal fracture of the notochord showing aggregates close to the notochord sheets (arrowheads). The collagen is found in close vicinity (white asterisks). e. Area magnified is delimited by the rectangle in panel d. Inset: Back-scattering electron imaging (BSE) of the same area observed in e PHENOTYPE:
|

New features in the tail fin bone observed by microCT-scan and FIB-SEM. a. Confocal fluorescence microscopy observations of the tail stained by a calcein solution. b) volume rendering and c) cross-section of the volume rendering using CT-scan of the tail fin at 30 dpf, at a resolution of 2.5 μm, shows unknown high density structures (arrowheads). d, e and f are FIB-SEM scan and 3D reconstructions, respectively, of the forming region of a mineralized tail in cross section (d and e) and reconstructed longitudinal section (f) at a resolution of 20 nm. The unidentified high density structures (arrowheads) are close to the lepidotrichia (bone) and between two actinotrichia (collagen bundles) (white asterisks in d). |
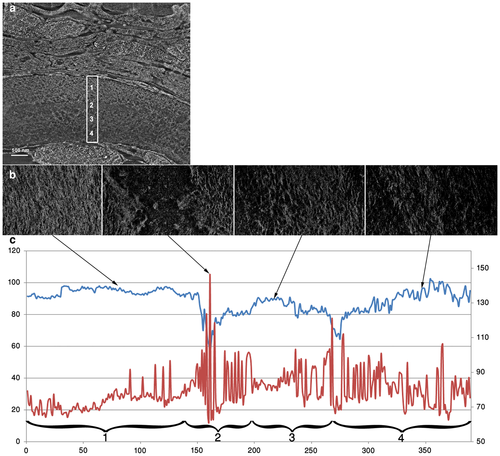
Directionality and dispersion analyses of the collagen fibrils in the tail bone at 30 dpf. a. FIB slice of the demineralized bone, observed in transverse plane. The rectangle spans the bone thickness. b. FIB slices characteristic of the different regions observed in the rectangle, observed in frontal plane, Slice 80 for region 1, slice 161 for region 2, slice 216 for region 3 and slice 346 for region 4. c. Direction (in blue) and dispersion (in red) plots of the collagen fibrils for each slice in the stack. The left vertical axis shows the azimuthal direction angle whereas the right shows the angular dispersion. |