- Title
-
Building Finite Element Models to Investigate Zebrafish Jaw Biomechanics
- Authors
- Brunt, L.H., Roddy, K.A., Rayfield, E.J., Hammond, C.L.
- Source
- Full text @ J. Vis. Exp.
|
Representative images of the musculoskeletal elements of the zebrafish lower jaw at 5 dpf. Representative confocal stacks of the lower jaw of 5dpf larvae all shown with anterior to top (A) Immunostaining for A4.1025 which stains all skeletal myosin (B) Immunostaining for Type II collagen which marks all cartilage (C) Stack from a live larva expressing the transgenic reporters col2a1:mCherry marking cartilage (red) and smyhc:GFP slow muscle (green). IA: intermandibularis anterior, PH: protractor hyoideus, AM:adductor mandibulae, HI: hyoideus inferior, HI: hyoideus superior, CH: sternohyoideus, MC: Meckel's cartilage, PQ: Palatoquadrate, CH: ceratohyal. |
|
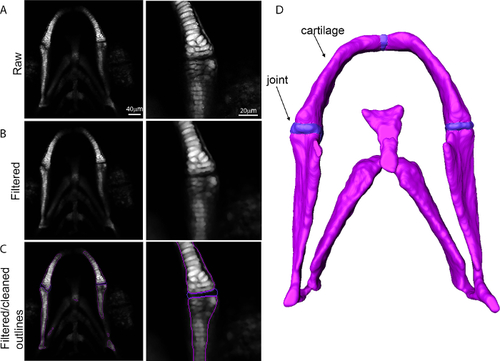
Generation of a 3D surface from confocal data. Images showing the transition from confocal data into a 3D surface for the zebrafish lower jaw with higher magnification of the joint region. (A) Raw confocal data; (B) Dataset after application of a Gaussian filter; (C) Filtered outline; (D) 3D surface. |
|
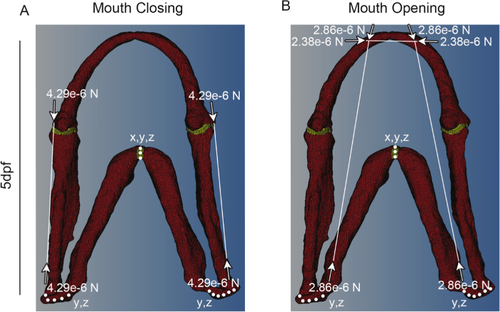
Representative meshes showing constraints and force vectors. Representative meshes for a 5 dpf larva for (A) mouth closing and (B) mouth opening. White dots denote places where the model is constrained and in which dimensions (e.g., x and y or x, y and z). White lines denote muscle positions, with the vector of muscle force denoted by white arrows. Red shows cartilage and Yellow the interzone. This figure has been modified from supplementary material previously published in Brunt et al. 15. |
|
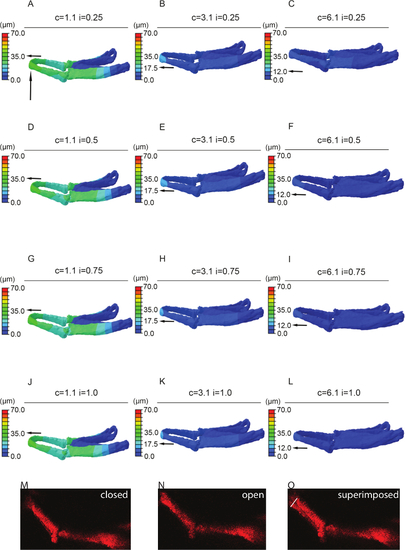
Sensitivity testing. FE-model simulating jaw displacement in 5dpf zebrafish for different cartilage and interzone Young's moduli. Jaw displacement (open to closed in µm) is marked on the jaw; recorded using the color key. Each model (A-L) has a different combination of cartilage (c = 1.1, 3.1, or 6.1 MPa) or interzone (i = of 0.25, 0.5, 0.75, or 1 MPa) properties. Horizontal black arrow highlights the value of jaw displacement at the tip of the Meckel's cartilage (represented by the vertical black arrow). M and N stills from videos of 5 dpf larvae showing minimum, i.e., jaw closed (M) and maximum, i.e., jaw fully open (N) with the two superimposed (O) - white line on O represents the displacement (of 43 µm). In this case relative cartilage properties of 1.1 with an interzone of 0.25 (A) best match the displacements seen in live fish (O). Panels A-L of this figure have been previously published in Brunt et al. 15. |
|
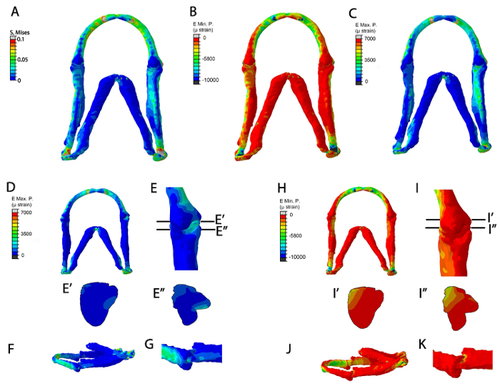
Representative data from the FE models. FE-model simulation of all muscles applied in a 5 dpf larva (A-C). (A) Von Mises (EMaxmin) (B) Minimum Principal strain (E Min. P, µɛ) (C) Maximum principal strain (E Max. P., µɛ). FE-model simulation of maximum and minimum principal strains during jaw opening. (D-K): Maximum principal strain (E Max. P., µɛ) in (D) ventral jaw view and (E) ventral joint view (E) shows location of proximal-distal sections through the Meckel's cartilage joint and the interzone in (E') and (E''), respectively. (F): lateral jaw view. (G): lateral joint view. (H-K): Minimum Principal strain (E Min. P, µɛ) in (H) ventral jaw view and (I) ventral joint view. (I) shows location of the proximal-distal sections through the Meckel's cartilage joint and interzone in (I') and (I'') respectively (J): lateral jaw view. (K): lateral joint view. This figure has been previously published in Brunt et al. 15. |


