
|
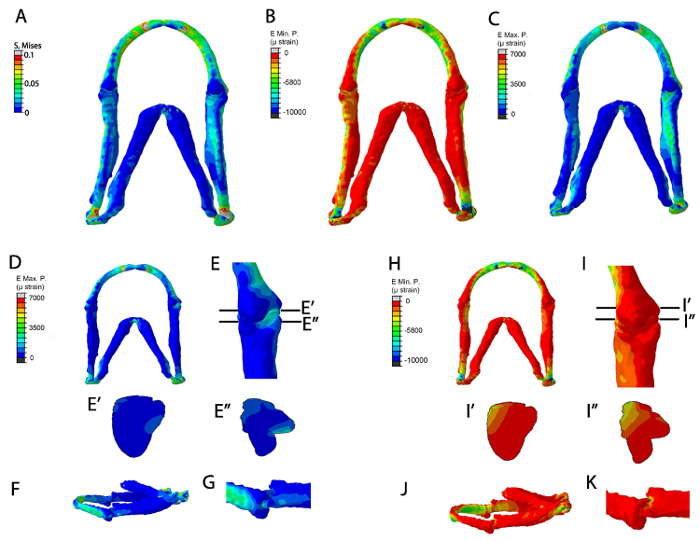
Fig. 5
Representative data from the FE models. FE-model simulation of all muscles applied in a 5 dpf larva (A-C). (A) Von Mises (EMaxmin) (B) Minimum Principal strain (E Min. P, µɛ) (C) Maximum principal strain (E Max. P., µɛ). FE-model simulation of maximum and minimum principal strains during jaw opening. (D-K): Maximum principal strain (E Max. P., µɛ) in (D) ventral jaw view and (E) ventral joint view (E) shows location of proximal-distal sections through the Meckel's cartilage joint and the interzone in (E') and (E''), respectively. (F): lateral jaw view. (G): lateral joint view. (H-K): Minimum Principal strain (E Min. P, µɛ) in (H) ventral jaw view and (I) ventral joint view. (I) shows location of the proximal-distal sections through the Meckel's cartilage joint and interzone in (I') and (I'') respectively (J): lateral jaw view. (K): lateral joint view. This figure has been previously published in Brunt et al. 15.