
- Title
-
The asparaginyl endopeptidase legumain is essential for functional recovery after spinal cord injury in adult zebrafish
- Authors
- Ma, L., Shen, Y.Q., Khatri, H.P., Schachner, M.
- Source
- Full text @ PLoS One
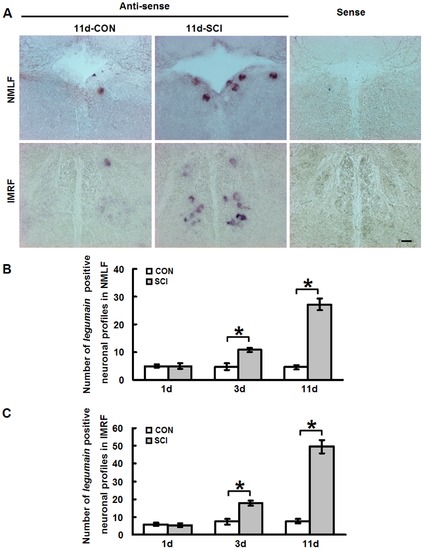
Legumain mRNA expression is upregulated in brainstem neurons during the axonal regrowth phase after SCI. (A) In situ hybridization was performed to study the expression of legumain in the NMLF and IMRF. Representative images depict legumain-positive cells in the NMLF and IMRF 11 days after SCI. More positive cells for legumain mRNA are observed in the NMLF and IMRF after SCI when compared with sham-injured control. With the sense control probe, no signal is observed. (B, C) Quantification shows that legumain mRNA expression is slightly upregulated in the NMLF and IMRF at 3 days and highly upregulated at 11 days after SCI. The expression patterns of legumain in the NMLF and IMRF are similar. Dorsal is up. NMLF, n = 6 fish; IMRF, n = 3 fish. * P<0.05, two-tailed t-test; mean values ±SEM are shown. Scale bar, 50 μm. EXPRESSION / LABELING:
|
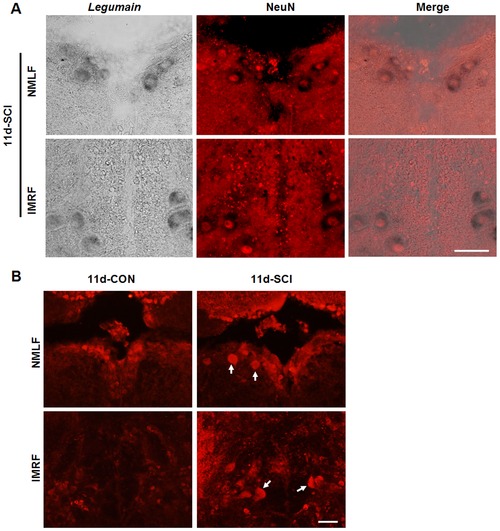
Upregulation of legumain expression in brainstem neurons at 11 days after SCI. (A) Double staining of legumain mRNA (in situ hybridization) and NeuN (immunohistochemistry) was performed to determine the identity of legumain-positive cells. The signal for NeuN locates in the nucleus and legumain mRNA locates in the neuronal cytoplasm in the NMLF and IMRF. (B) Immunohistochemistry for Legumain shows more Legumain positive neurons (arrows) in the NMLF and IMRF at 11 days after SCI when compared to the sham-injured control. Dorsal is up. A, n = 3 experiments; B, n = 3 fish. Scale bar, 50 μm. EXPRESSION / LABELING:
|
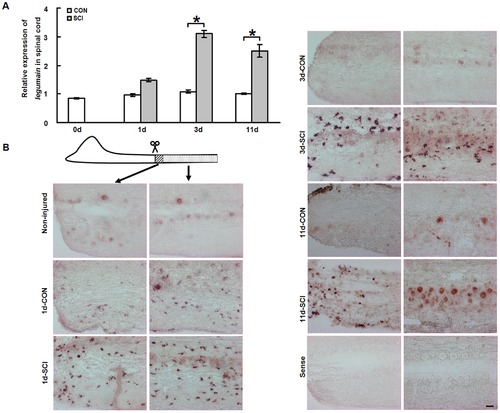
Legumain mRNA expression is upregulated in the caudal spinal cord after SCI. (A) Quantitative real-time PCR (qPCR) shows that legumain mRNA expression increases from 3 days post-injury and remains upregulated at 11 days after SCI. (B) In situ hybridization for legumain mRNA in the caudal spinal cord shows different expression patterns in the lesion site (area with stripes) and the caudal part of spinal cord (area with dots). In the non-injured spinal cord, legumain mRNA is only observed in neurons. In the lesion site, legumain mRNA is observed in many small cells at all time points tested after SCI. In the spinal cord caudal to the lesion site, legumain mRNA is detectable in small cells in both the sham-injured and SCI groups at 1 day, with a stronger signal for legumain mRNA after SCI compared to the sham injury group. At 3 days, while the signal for legumain mRNA in small cells is not detectable anymore in the sham-injured group, strong positive signal for legumain mRNA expression is observed in small cells in the SCI group. At 11 days, more positive neurons are seen after SCI compared to the sham-injury group. No signal is detectable with the sense probe. Rostral is left and caudal is right. A, n = 3 experiments; B, n = 4 fish for each group. * P<0.05, two-way ANOVA with Tukey′s post hoc test; mean values ±SEM are shown. Scale bar, 50 μm. EXPRESSION / LABELING:
|
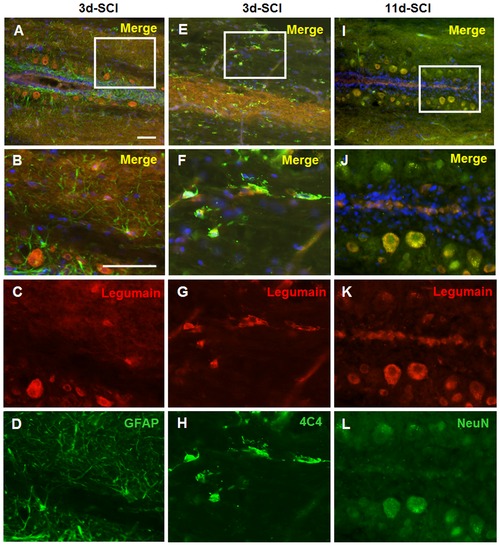
Neurons and macrophages/microglia express Legumain in the caudal spinal cord after SCI. Spinal cord sections from fish 3 days after SCI were used for double staining of Legumain and GFAP (A–D) or 4C4 (E–H). Spinal cord sections from fish 11 days after SCI were used for double staining of Legumain and NeuN (I–L). B, F, and J are the magnifications of A, E and I, respectively. No co-localization of Legumain and GFAP is observed (A–D). Double immunostaining of Legumain with 4C4 antibody identifies the positive small cells as macrophages/microglia (E–H). Double staining with NeuN shows that neurons express Legumain at 11 days after SCI (I–L). n = 3 experiments. Scale bar, 50 μm. EXPRESSION / LABELING:
|

Legumain MO treatment inhibits locomotor recovery after SCI. (A, B) Legumain MO1 and MO2 knockdown Legumain protein expression as tested at 11 days after SCI. Legumain MO1 and legumain MO2 reduce the numbers of Legumain expressing neurons. Magnifications of the squared area are shown. (C) Total distance moved by fish treated with standard control (CON) MO, legumain MO1, or legumain MO2 was measured at 6 weeks after MO treatment. Legumain MO1 (n = 14 fish) or legumain MO2 (n = 11 fish) treatments reduce the total distance moved when compared with CON MO treatment (n = 11 fish). Dorsal is up. A, n = 3 experiments. * P<0.05, one-way ANOVA with Tukey′s post hoc test; mean values ±SEM are shown. Scale bar, 50 μm. |

Legumain MOs inhibit axonal regrowth after SCI. (A) Representative images of neurons retrogradely labeled in the NMLF and IMRF 6 weeks after SCI. (B) Quantification of biocytin-labeled neuronal profiles in fish that had received legumain MO1 (n = 7 fish), legumain MO2 (n = 6 fish) or CON MO (n = 6 fish). Legumain MO1 and MO2 treatments reduce the numbers of biocytin-labeled neuronal profiles in the NMLF and IMRF when compared with CON MO treatment. Dorsal is up. * P<0.05, one-way ANOVA with Tukey′s post hoc test; mean values ±SEM are shown. Scale bar, 50 μm. PHENOTYPE:
|