
|
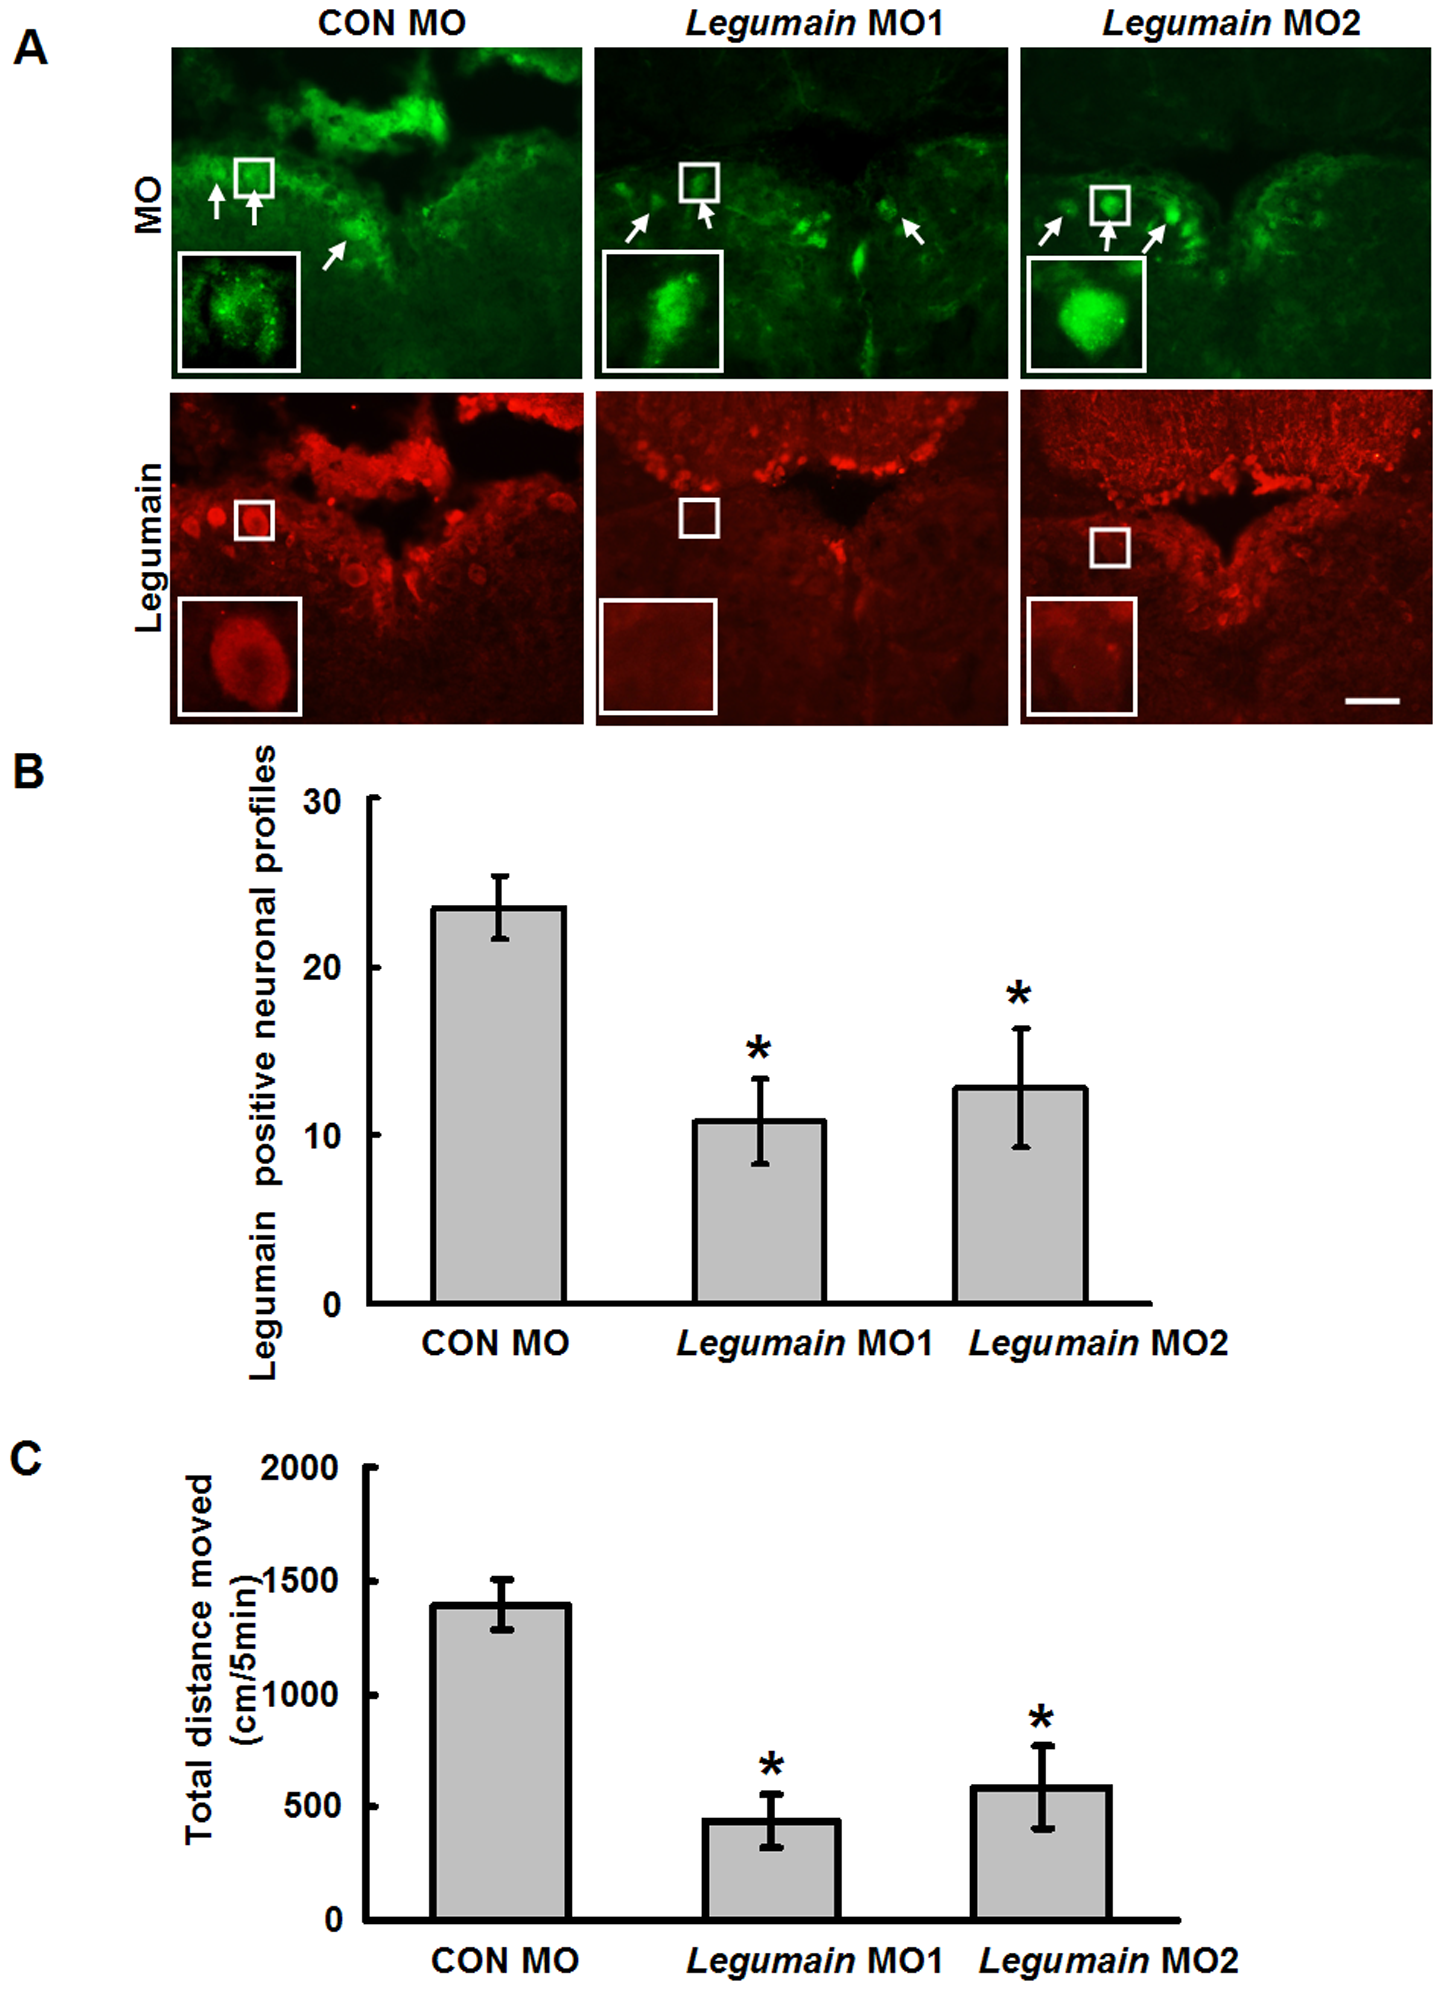
Fig. 5
Legumain MO treatment inhibits locomotor recovery after SCI.
(A, B) Legumain MO1 and MO2 knockdown Legumain protein expression as tested at 11 days after SCI. Legumain MO1 and legumain MO2 reduce the numbers of Legumain expressing neurons. Magnifications of the squared area are shown. (C) Total distance moved by fish treated with standard control (CON) MO, legumain MO1, or legumain MO2 was measured at 6 weeks after MO treatment. Legumain MO1 (n = 14 fish) or legumain MO2 (n = 11 fish) treatments reduce the total distance moved when compared with CON MO treatment (n = 11 fish). Dorsal is up. A, n = 3 experiments. * P<0.05, one-way ANOVA with Tukey′s post hoc test; mean values ±SEM are shown. Scale bar, 50 μm.