
Image
|
Figure Caption
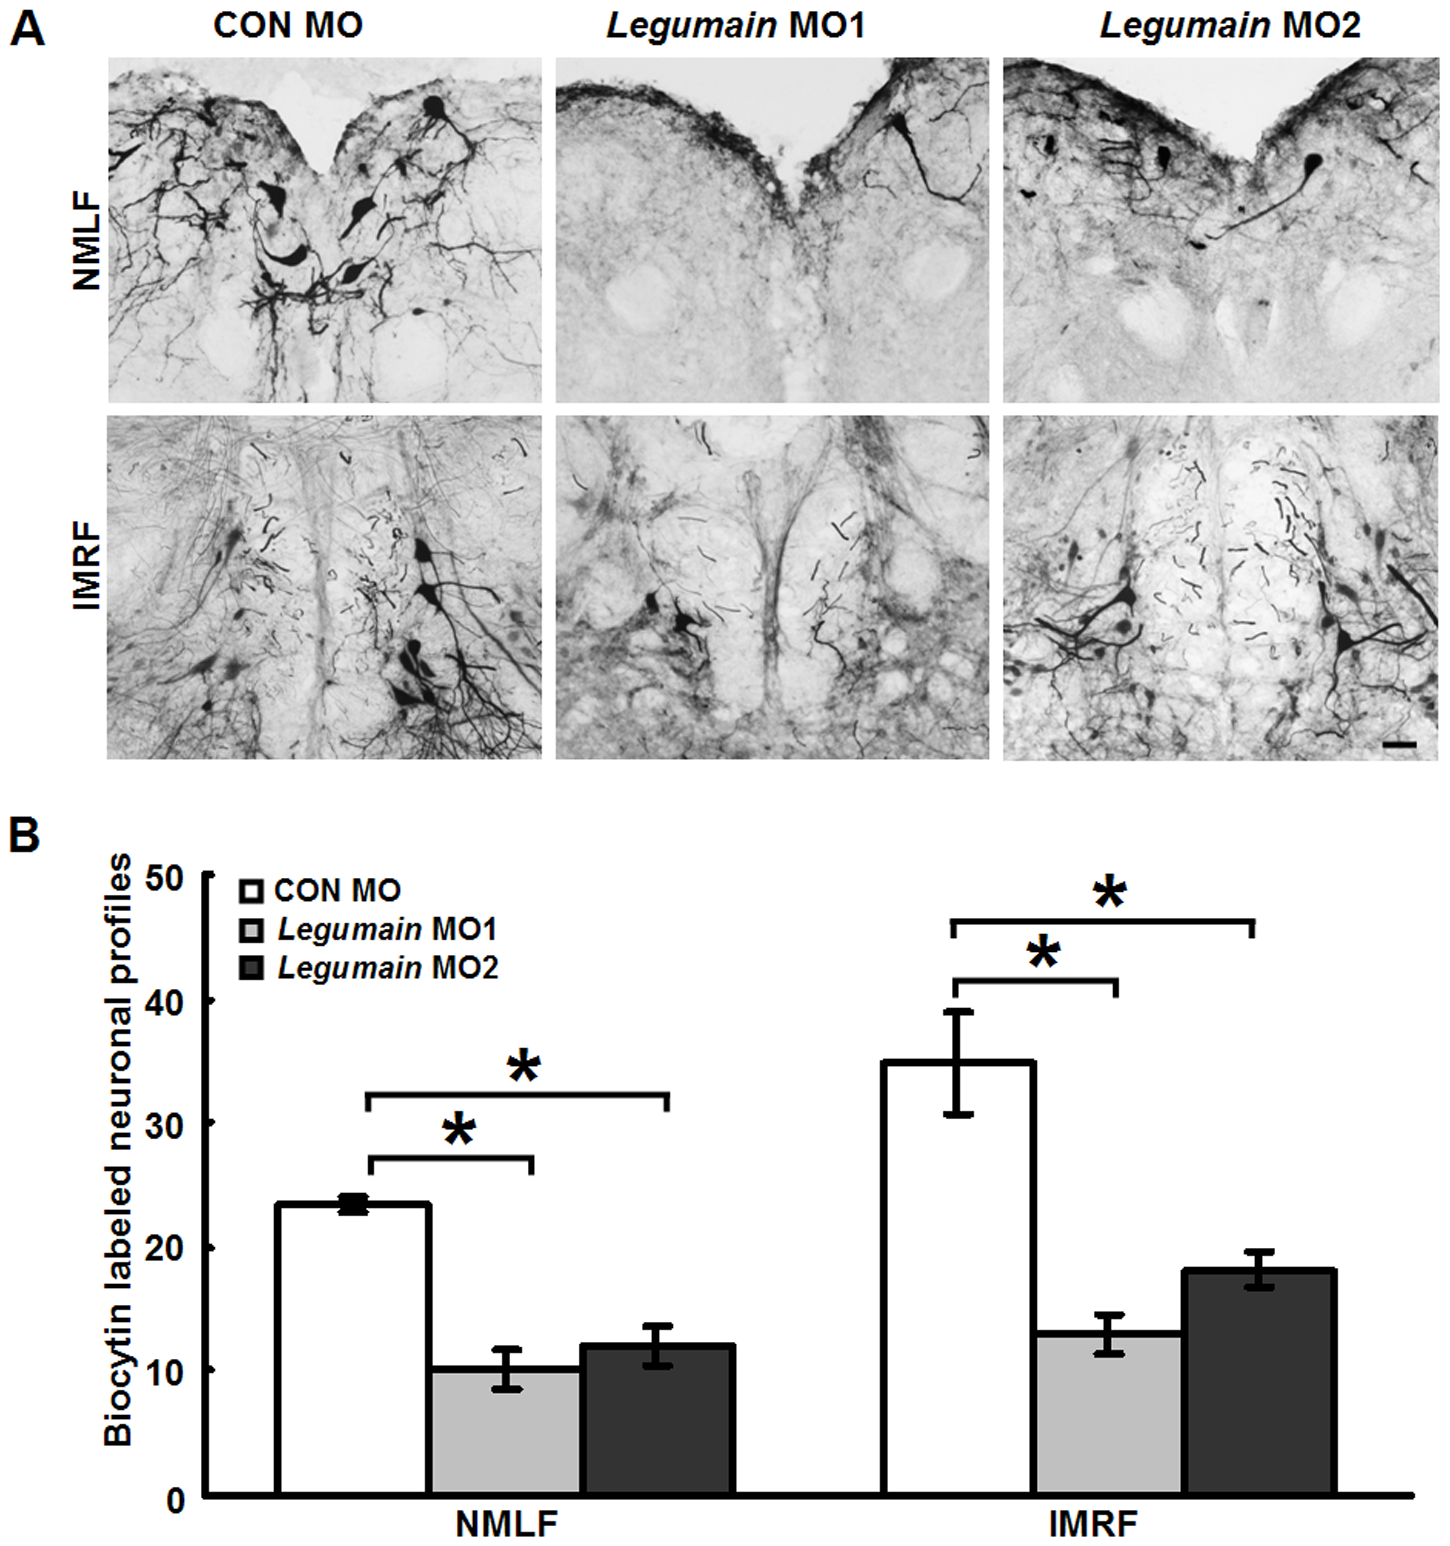
Fig. 6
Legumain MOs inhibit axonal regrowth after SCI.
(A) Representative images of neurons retrogradely labeled in the NMLF and IMRF 6 weeks after SCI. (B) Quantification of biocytin-labeled neuronal profiles in fish that had received legumain MO1 (n = 7 fish), legumain MO2 (n = 6 fish) or CON MO (n = 6 fish). Legumain MO1 and MO2 treatments reduce the numbers of biocytin-labeled neuronal profiles in the NMLF and IMRF when compared with CON MO treatment. Dorsal is up. * P<0.05, one-way ANOVA with Tukey′s post hoc test; mean values ±SEM are shown. Scale bar, 50 μm.
Figure Data
Acknowledgments
This image is the copyrighted work of the attributed author or publisher, and
ZFIN has permission only to display this image to its users.
Additional permissions should be obtained from the applicable author or publisher of the image.
Full text @ PLoS One