
Fig. 5
- ID
- ZDB-IMAGE-260731-33
- Genes
- Publication
- Li et al., 2026 - The accumulation of methylglyoxal and acrolein impairs arginine homeostasis causing hyperglycemia and renal abnormalities in male zebrafish
- All Figures
- Figures for Li et al., 2026
|
Fig. 5
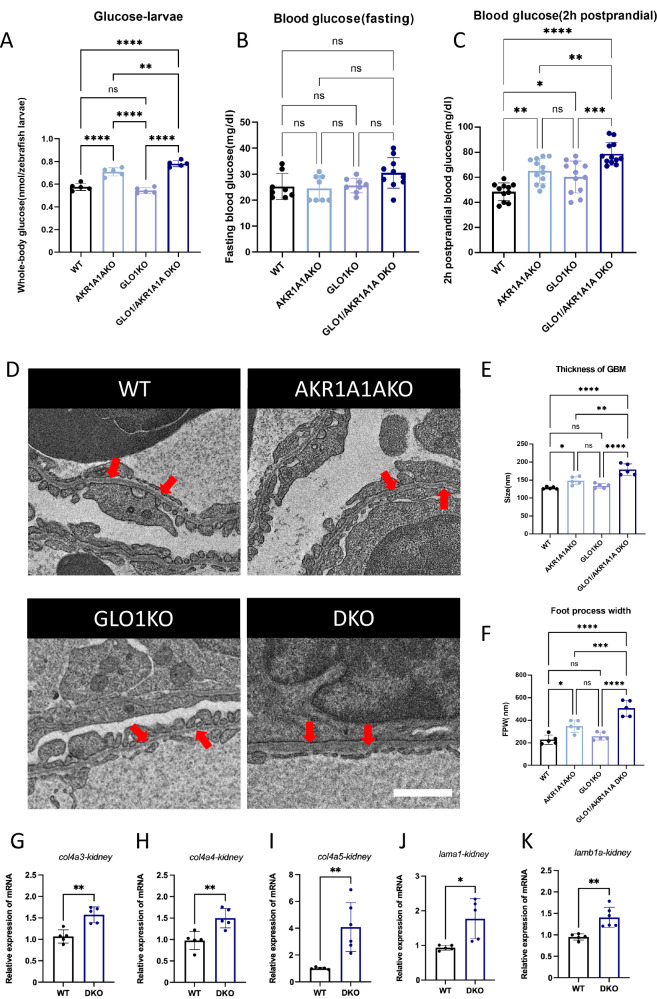
Aggravated hyperglycemia, thickened GBM and podocyte effacement in Tg(fli1:EGFP) GLO1/AKR1A1A DKO zebrafish.
A The whole-body glucose levels in GLO1/AKR1A1A DKO larvae at 96hpf were the highest compared to WT, GLO1KO and AKR1A1AKO larvae. n = 5 biological replicates per group. Exact p values for each comparation are: WT vs. AKR1A1AKO, WT vs. DKO, AKR1A1AKO vs. GLO1KO, GLO1KO vs. DKO, p < 0.0001; AKR1A1AKO vs. DKO, p = 0.008. hpf, hours of post fertilization. B Fasting blood glucose levels in DKO adult zebrafish at 12mpf were unaltered. n = 8/10 biological replicates per group. mpf, months of post fertilization. C 2-hour postprandial blood glucose levels in DKO adult zebrafish at 12mpf were further elevated compared to WT, GLO1KO and AKR1A1AKO adult zebrafish. n = 11/12 biological replicates per group. Exact p values for each comparation are: WT vs. AKR1A1AKO, p = 0.0012; WT vs. GLO1KO, p = 0.0333; WT vs. DKO, p < 0.0001; AKR1A1AKO vs. DKO, p = 0.0089; GLO1KO vs. DKO, p = 0.0002. D Representative electron micrographs of glomeruli from WT, GLO1KO, AKR1A1AKO and DKO adult zebrafish. Red arrows indicated GBM. White scale bar = 1 µm. GBM, glomerular basement membrane. E Quantification of GBM thickness in adult zebrafish, showing a significant increase in the DKO group compared to WT, GLO1KO, and AKR1A1AKO groups. n = 5 biological replicates per group. Exact p values for each comparation are: WT vs. AKR1A1AKO, p = 0.0293; WT vs. DKO, GLO1KO vs. DKO, p < 0.0001; AKR1A1AKO vs. DKO, p = 0.0012. F Quantification of FPW in adult zebrafish, showing a significant increase in the DKO group compared to WT, GLO1KO, and AKR1A1AKO groups. n = 5 biological replicates per group. Exact p values for each comparation are: WT vs. AKR1A1AKO, p = 0.0107; WT vs. DKO, p < 0.0001; GLO1KO vs. DKO, p < 0.0001; AKR1A1AKO vs. DKO, p = 0.0009. FPW, foot process width. G–K Relative mRNA expression levels of col4a3, col4a4, col4a5, lama1, lamb1a were upregulated in DKO kidney compared to WT. n = 5/6 biological replicates per group. Exact p values for each comparation are: col4a3, p = 0.0017; col4a4, p = 0.0055; col4a5, p = 0.0089; lama1, p = 0.0310; lamb1a, p = 0.0040. col4a3, collagen-type IV, alpha 3; col4a4, collagen-type IV, alpha 4; col4a5, collagen-type IV, alpha 5; lama1, laminin-alpha 1; lamb1a, laminin-beta 1a. mRNA expression levels were quantified by RT-qPCR and normalized to arnt 2. arnt2, aryl hydrocarbon receptor nuclear translocator 2. The bars indicate mean ± SD values. Statistical analysis were performed by a two-tailed Student’s t-test and one-way ANOVA. ns, not significant, *p < 0.05, **p < 0.01, ***p < 0.001, ****p < 0.0001. Source data are provided as a Source Data file.