
Fig 8
- ID
- ZDB-IMAGE-260613-3
- Genes
- Antibodies
- Publication
- Lubash et al., 2026 - RNA Polymerase III subunit Polr3a is required for craniofacial cartilage and bone development in zebrafish
- All Figures
- Figures for Lubash et al., 2026
|
Fig 8
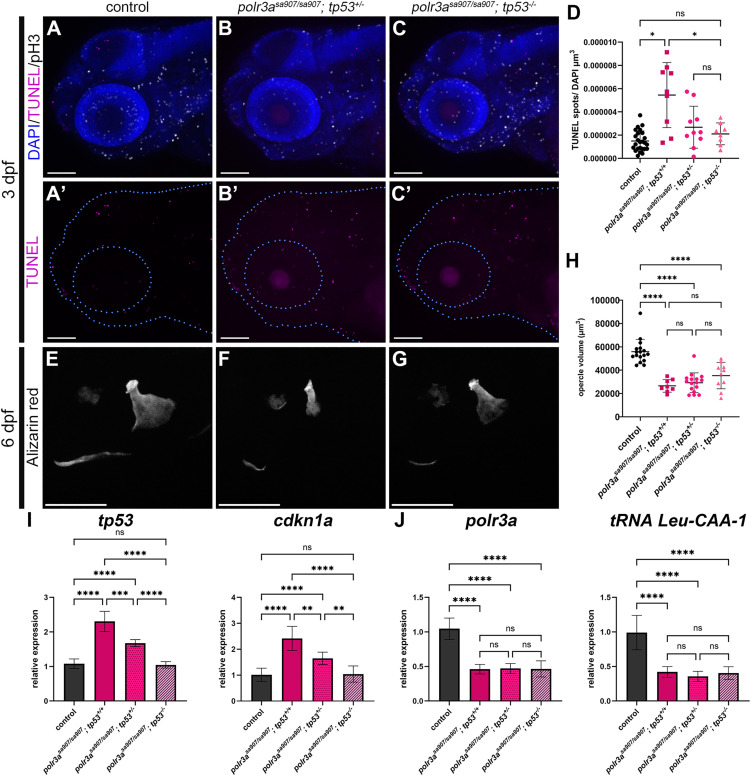
Genetic inhibition of tp53 reduces cell death and leads to slight improvements in polr3asa907/sa907 zebrafish.
(A-D) TUNEL (magenta) and pH3 (white) staining at 3 dpf. Quantification reveals a decrease in global cell death (D; *p = 0.013 control vs polr3asa907/sa907; tp53+/+; *p = 0.038 polr3asa907/sa907; tp53+/+ vs. polr3asa907/sa907; tp53-/-), but no change in proliferation (see S20 Fig). n = 25 controls, n = 9 polr3asa907/sa907; tp53+/+, n = 10 polr3asa907/sa907; tp53+/-, n = 8 polr3asa907/sa907; tp53-/-.(E-H) Alizarin red stain of the opercle at 6 dpf shows slight improvements in morphology, but no statistically significant improvement in the overall volume of the opercle in polr3asa907/sa907; tp53-/- zebrafish (H; ****p < 0.0001). n = 17 controls, n = 8 polr3asa907/sa907; tp53+/+, n = 16 polr3asa907/sa907; tp53+/-, n = 10 polr3asa907/sa907; tp53-/-. Scale bar = 100 µm. (I) qRT-PCR for tp53 and cdkn1a at 3 dpf demonstrates a dosage-dependent reduction in expression in polr3asa907/sa907 zebrafish based on tp53 status. Expression levels of tp53 and cdkn1a in polr3asa907/sa907; tp53-/- zebrafish are not significantly different from controls. Adjusted p-values: **p < 0.005, ***p = 0.0007, ****p < 0.0001. (J) qRT-PCR for polr3a and tRNA-Leu-CAA-1-1 demonstrate that expression levels of these genes remain reduced in polr3asa907/sa907 zebrafish regardless of tp53 status. Adjusted p-values: ****p < 0.0001.