
Fig. 4
- ID
- ZDB-IMAGE-250819-4
- Genes
- Antibodies
- Publication
- Wu et al., 2025 - Atp7a deficiency induces axonal and myelin developmental defects in zebrafish via ferroptosis
- All Figures
- Figures for Wu et al., 2025
|
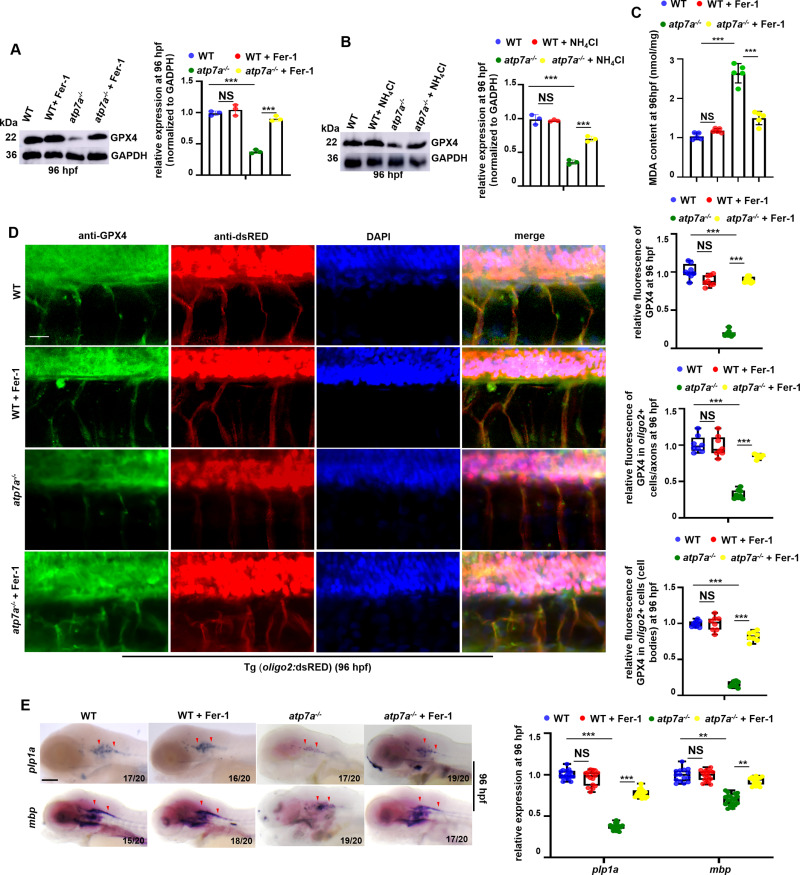
Fig. 4 Alleviating ferroptosis can effectively restore GPX4 expression and CNS myelin and axon developmental defects in atp7a−/− larvae. (A) The relative protein level of GPX4 in WT and atp7a−/− embryos treated with or without Fer-1 at 96 hpf, with GADPH as an internal control (graphs). (B) WB analysis of the relative protein level of GPX4 in WT and atp7a−/− embryos treated with or without NH4Cl at 96 hpf, with GADPH as an internal control (graphs). (C) MDA content in WT and atp7a−/− embryos treated with or without Fer-1 at 96 hpf. Each dot represents one repeat. The calculation assay is followed for the next MDA content data. (D) Staining of oligo2+ cells (RED) with GPX4 (GFP) in WT or atp7a−/− larvae from groups with or without Fer-1 treatment at 96 hpf, and the calculation of the relative fluorescence level of GPX4 (up) and GPX4 fluorescence intensity in oligo2+ cell axons (middle) and GPX4 fluorescence intensity in oligo2+ cell bodies (down) (box and whisker plots). (E) Transcriptional expressions of CNS myelin genes mbp and plp1a in WT or atp7a−/− larvae from groups with or without Fer-1 treatment at 96 hpf, and the calculation of the relative expressions of mbp and plp1a (box and whisker plots) at 96 hpf. E, lateral view, anterior to the left.Scale bar: 50 μm (D), 100 μm (E). *P < 0.05, **P < 0.01, ***P < 0.001. NS, not significant. (For interpretation of the references to colour in this figure legend, the reader is referred to the web version of this article.)