
Fig. 4
- ID
- ZDB-IMAGE-250305-22
- Genes
- Antibodies
- Publication
- Ma et al., 2025 - Establishment and application of a zebrafish model of Werner syndrome identifies sapanisertib as a potential antiaging drug
- All Figures
- Figures for Ma et al., 2025
|
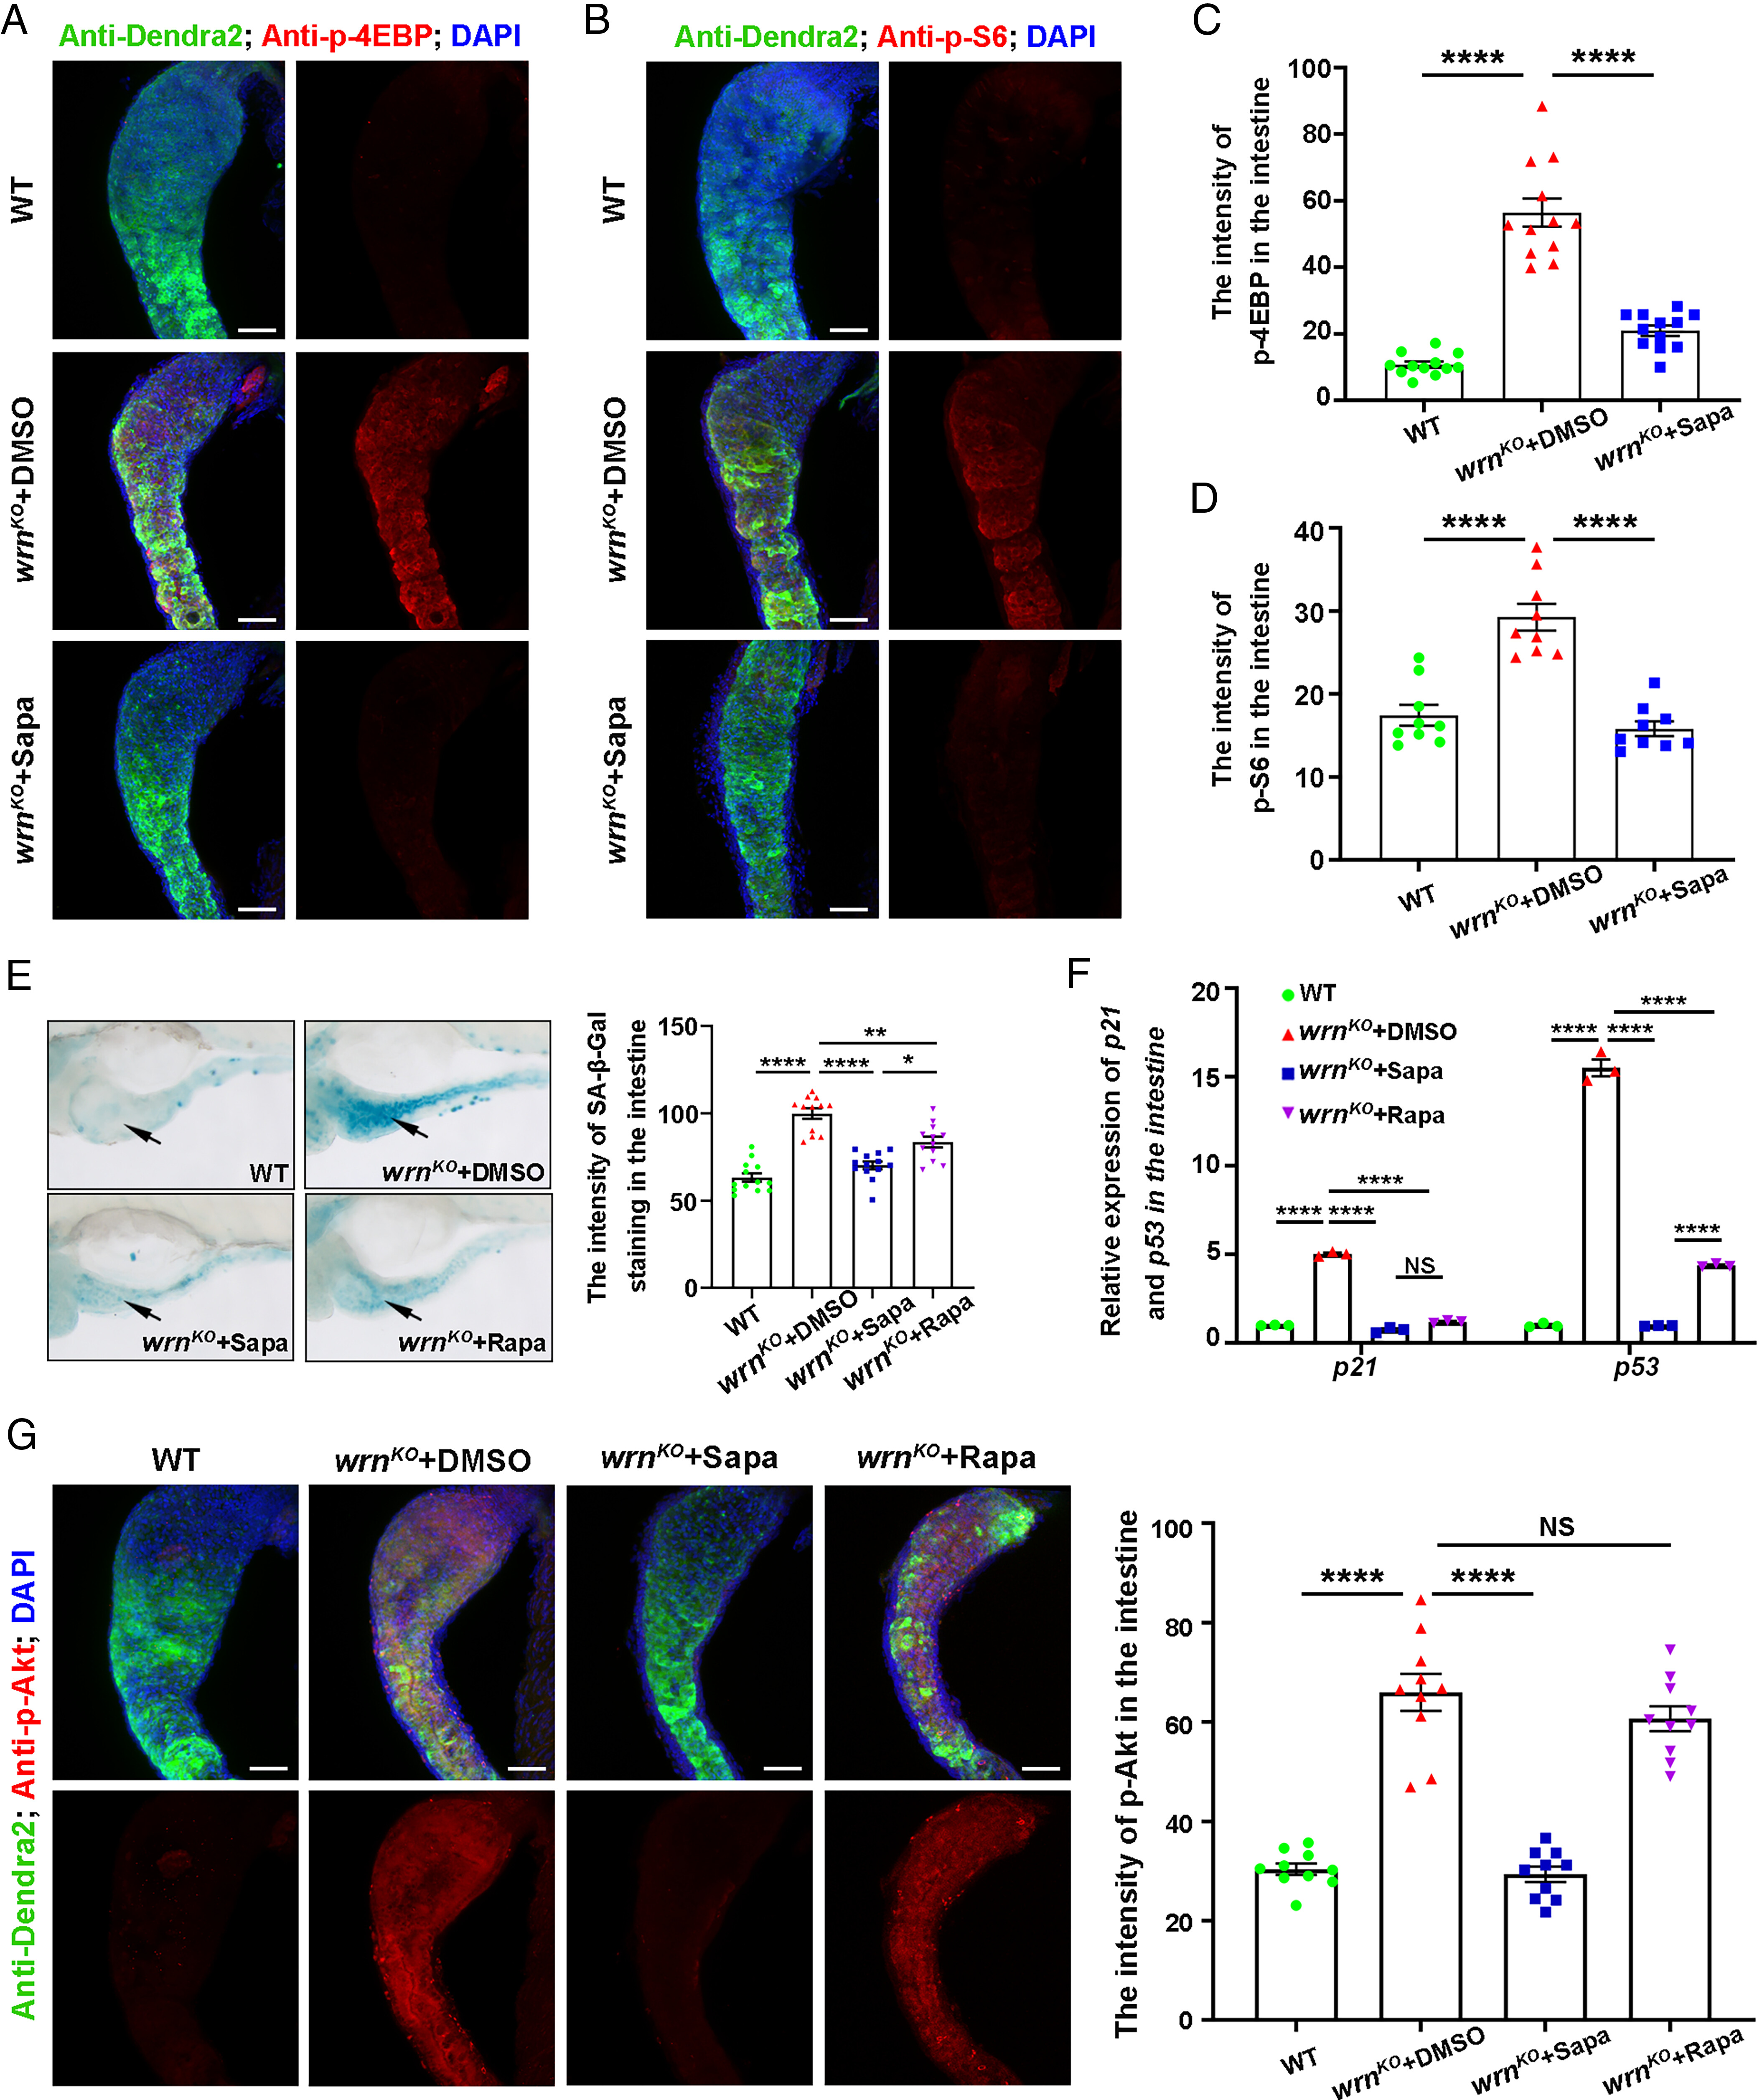
Fig. 4 Sapanisertib may attenuate the aging phenotypes of the wrnKO mutant by inhibiting mTORC1/2 signaling. (A–D) Confocal projection images showing the expression of p-4EBP (A, red), p-S6 (B, red), Dendra2 (green), and DAPI (blue) in the intestine of Tg(fabp2:Dendra2-NTR) among WT, wrnKO + DMSO, and wrnKO + Sapa groups at 8dpf. Quantification of the intensity of p-4EBP (C, n = 12 for each group) and p-S6 (D, n = 9 for each group). (E) Representative image of SA-β-Gal staining and quantification of the intensity of SA-β-Gal staining in the intestine at 8 dpf (n = 11 to 14 for each group). Arrows indicate the intestine region. (F) qPCR analysis of age-related gene expression (p21 and p53) in intestinal samples at 8 dpf (n = 40 for each group). (G) Confocal projection images showing the expression of p-Akt (red), Dendra2 (green), and DAPI (blue) in the intestine of Tg(fabp2:Dendra2-NTR) among WT, wrnKO+DMSO, wrnKO+Sapa, and wrnKO+Rapa groups at 8dpf. Quantification of the intensity of p-Akt (n = 10 for each group). (Scale bar, 50 μm.) Data are presented as mean ± SEM. Significance was determined by one-way ANOVA. NS, not significant; *P < 0.05; **P < 0.01; ****P < 0.0001. Rapa, rapamycin.