
Fig. 1
- ID
- ZDB-IMAGE-250211-8
- Genes
- Antibodies
- Publication
- Hollander-Cohen et al., 2024 - The satiety hormone cholecystokinin gates reproduction in fish by controlling gonadotropin secretion
- All Figures
- Figures for Hollander-Cohen et al., 2024
|
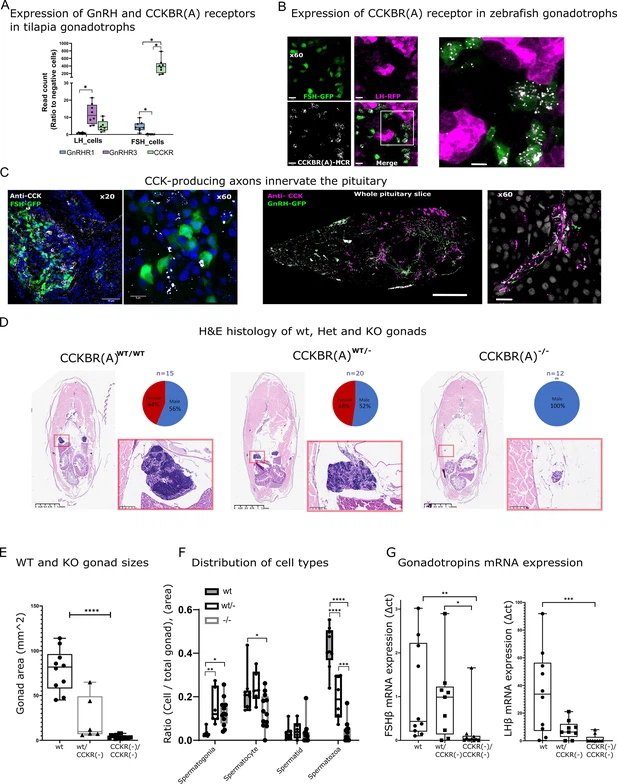
Fig. 1 Effect of CCKBR(A) loss-of-function mutation on gonadal development. (A) Expression of CCKBR(A) and two identified gonadotropin-releasing hormone (GnRH) receptors in luteinizing hormone (LH) and Follicle-Stimulating Hormone (FSH) cells. Expression data were taken from a transcriptome of sorted pituitary cells of transgenic Nile tilapia Oreochromis niloticus, previously obtained by Hollander-Cohen et al., 2021. Each dot represents a FACS fraction from a bulk of 20 pituitaries (n=8, 4 groups of males and 4 groups of females). The expression of each gene in each cell type is normalised to its expression in non-gonadotroph pituitary cells. (two-way ANOVA, * p<0.05,). (B) RNA expression of CCKBR(A) (white) identified by hybridization chain reaction (HCR) in transgenic zebrafish pituitaries expressing RFP in LH cells (magenta) and GFP in FSH cells (green) (scale bar = 10 µm), the right panel is a magnification of the white square in the left panel. (C) Immunohistochemical staining of cholecystokinin (CCK) (white) in transgenic zebrafish expressing GFP in FSH cells (left panel, scale bar = 50 µm and 8 µm) or GFP in GnRH neurons (right panel, scale bar = 100 µm and 10 µm). In B and C, staining from adult fish was performed on whole head sections 15 µm thick. (D) H&E staining of body cross-sections (dorsoventral axis) of adult WT, heterozygous (CCKBR(A)wt/+12, CCKBR(A)wt/+7/, CCKBR(A)wt/-1), and KO zebrafish (CCKBR(A)+12/+12, CCKBR(A) +7/+7,CCKBR(A)-1/-1). An inset of the red square in each image on the right displays a magnified view of the gonad. On the top right of each panel is the sex distribution for each genotype. (E) Gonad areas of mutant zebrafish. (n((+/+),(+/-), (-/-))=10/6/17,one way ANOVA,, ****p<0.0001). (F) The distribution of cell types in the gonads of WT, heterozygous, and KO zebrafish. (n((+/+),(+/-), (-/-))=10/6/17, two-way ANOVA, *p<0.05, **p<0.001, ***p<0.0001,****p<0.00001). (G) Gonadotroph mRNA expression in the pituitaries of the three genotypes (n((wt/wt),(wt/-), (-/-))=10/8/9, one-way ANOVA, *p<0.05, **p<0.01, ***p<0.001).