
IMAGE
Fig. 6.
- ID
- ZDB-IMAGE-250109-181
- Genes
- Publication
- Rolfs et al., 2024 - myh9b is a critical non-muscle myosin II encoding gene that interacts with myh9a and myh10 during zebrafish development in both compensatory and redundant pathways
- All Figures
- Figures for Rolfs et al., 2024
Image
|
Figure Caption
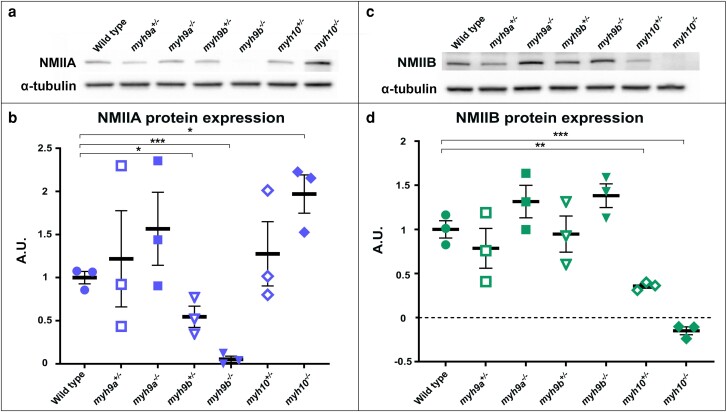
Fig. 6.
NMIIA and NMIIB protein levels in the zebrafish
Figure Data
Acknowledgments
This image is the copyrighted work of the attributed author or publisher, and
ZFIN has permission only to display this image to its users.
Additional permissions should be obtained from the applicable author or publisher of the image.
Full text @ G3 (Bethesda)