
Fig. 5
- ID
- ZDB-IMAGE-231215-186
- Genes
- Publication
- Kapuria et al., 2022 - Heterogeneous pdgfrβ+ cells regulate coronary vessel development and revascularization during heart regeneration
- All Figures
- Figures for Kapuria et al., 2022
|
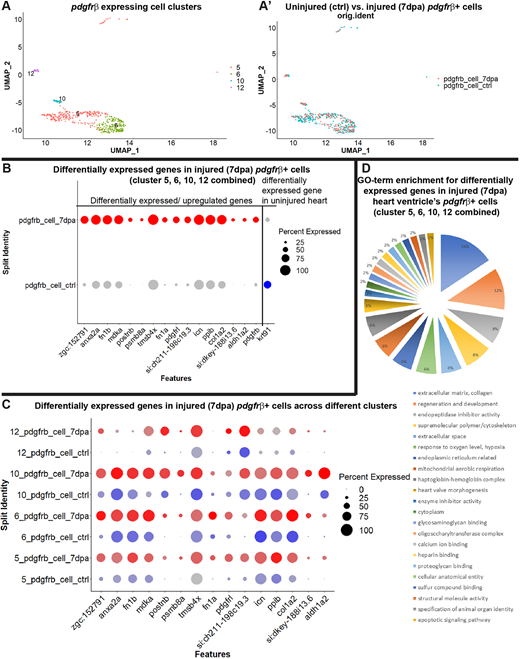
Fig. 5 Characterization of the pdgfrb+ cells in regenerating hearts after amputation. (A,A′) The epicardial/EPDC and mural cell clusters (5, 6, 10 and 12) of FACS-sorted pdgfrb:EGFP+ from uninjured and injured (7 dpa) fish hearts. (A) UMAP plot of integrated uninjured and 7 dpa epicardial/EPDC and mural cells. (A′) UMAP plot of cells from uninjured (blue) and 7 dpa (red) hearts. (B) Dot plot of the differentially expressed genes in FACS-sorted pdgfrb:EGFP-expressing cells analyzed by combining clusters 5, 6, 10 and 12. Blue dot, represents uninjured hearts. Red dots represent 7 dpa hearts. Expression level across cells within the cluster is shown by intensity of the color and the percentage of the cells expressing the marker gene is shown by the size of the dot (0-100%). Differentially expressed genes were determined with minimum percent expression cut-off=0.1 and minimum average log fold change=0.25, adjusted P≤0.001. (C) Dot plot of the differentially expressed genes in FACS-sorted pdgfrb:EGFP-expressing cells in clusters 5, 6, 10 and 12. (D) Categorizations and relative enrichments of GO terms derived from the differentially expressed genes in the combined clusters 5, 6, 10 and 12. Genes are selected with adjusted P-value≤0.1 and enriched GO terms were selected with Holm–Bonferroni correction P≤0.05.