
FIGURE 3
- ID
- ZDB-IMAGE-230724-40
- Genes
- Antibodies
- Publication
- Chi et al., 2023 - The interplay of common genetic variants NRG1 rs2439302 and RET rs2435357 increases the risk of developing Hirschsprung's disease
- All Figures
- Figures for Chi et al., 2023
|
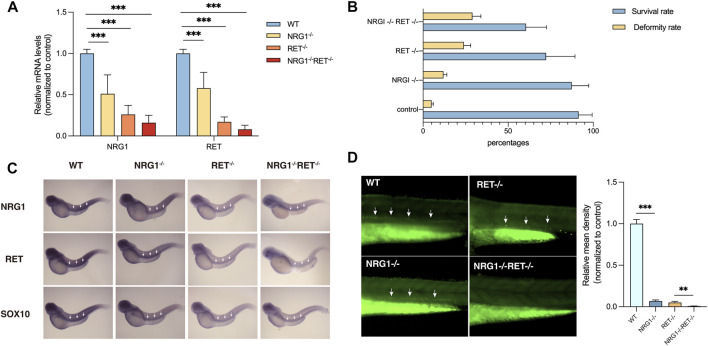
FIGURE 3
Phenotypes of nrg1 and ret knockdown zebrafish. (A) qRT-PCR analysis of relative expression levels of nrg1 and ret in wildtype, nrg1−/−, ret−/−, and nrg1−/−ret−/− zebrafish embryos at 72 hpf. (B) The survival and deformity rate of wildtype, nrg1−/−, ret−/−, and nrg1−/−ret−/− zebrafish at 72 hpf. (C) Whole-mount in situ hybridization in wildtype, nrg1−/−, ret−/−, and nrg1−/−ret−/− embryos at 72 hpf for nrg1, ret, and sox10. White arrows indicated the end of the positive expression of each gene. (D) Immunofluorescence staining and quantitative analysis of a neuronal marker HuC/D in wildtype, nrg1−/−, ret−/−, and nrg1−/−ret−/− embryos at 72 hpf.