
Figure 4
- ID
- ZDB-IMAGE-230529-32
- Genes
- Publication
- Huang et al., 2023 - CRISPR/Cas9-Mediated Knockout of tnfaip1 in Zebrafish Plays a Role in Early Development
- All Figures
- Figures for Huang et al., 2023
|
Figure 4
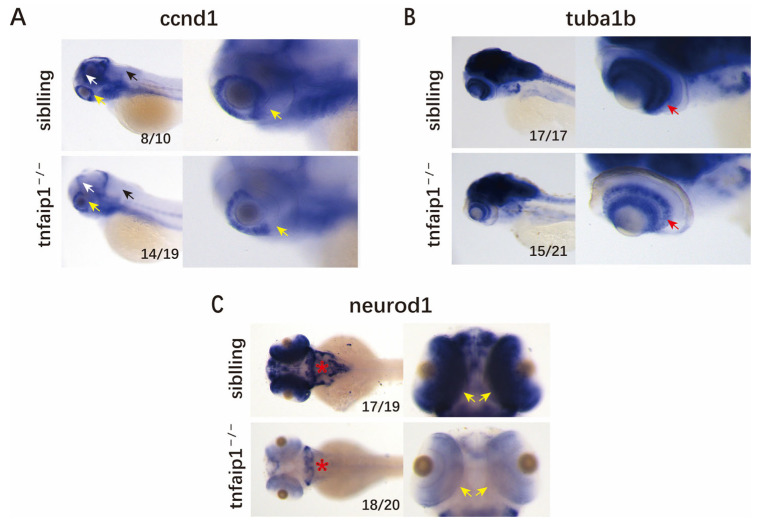
Tnfaip1 mutation in zebrafish results in reduced expression of neuronal marker genes. (A) In situ hybridization assay for the 72 hpf wild-type sibling and tnfaip1−/− embryos neuronal marker gene ccnd1. Yellow arrows indicate the retinal; white arrows indicate the tectum proliferative zone; black arrows indicate the hindbrain. Scale bar: 250 μm. (B) In situ hybridization assay for the 72 hpf wild-type sibling and tnfaip1−/− embryos neuronal marker gene tuba1b. Red arrow indicates the retinal. Scale bar: 250 μm. (C) In situ hybridization assay for the 72 hpf wild-type sibling and tnfaip1−/− embryos neuronal marker gene neurod1. Red asterisks indicate the brain; yellow arrows indicate the retinal. Scale bar: 250 μm.