
Figure 5
- ID
- ZDB-IMAGE-230211-134
- Genes
- Publication
- Morgan et al., 2023 - ahctf1 and kras mutations combine to amplify oncogenic stress and restrict liver overgrowth in a zebrafish model of hepatocellular carcinoma
- All Figures
- Figures for Morgan et al., 2023
|
Figure 5
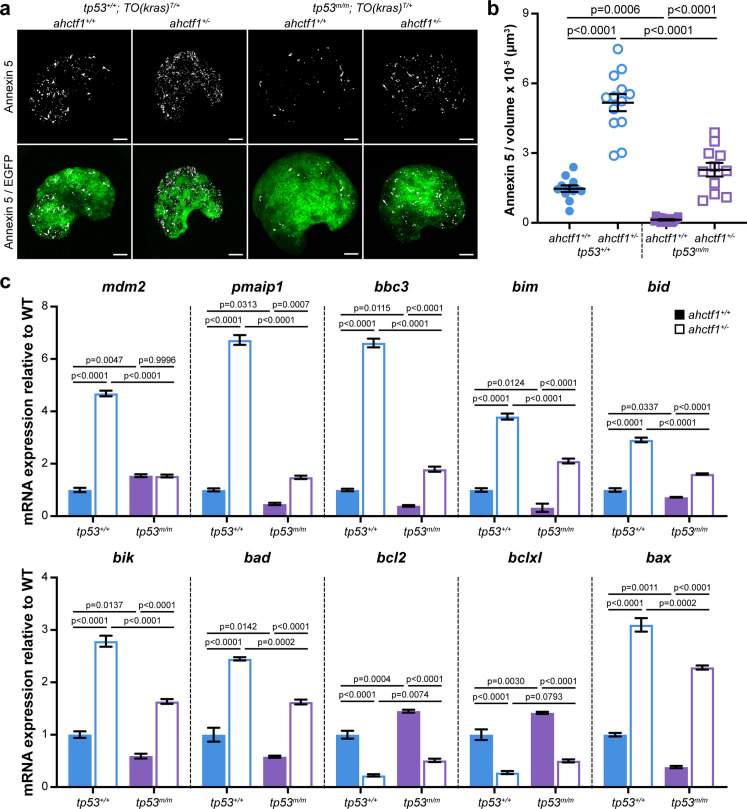
(a) Representative maximum intensity projection images of Annexin 5-mKate fluorescence (white puncta), indicating cells undergoing apoptosis in TO(krasG12V)T/+ livers of the indicated ahctf1 and tp53 genotypes. Scale bar 25 µm. (b) Quantification of the density of Annexin 5 fluorescent foci in TO(krasG12V)T/+ livers of the indicated ahctf1 and tp53 genotypes (n ≥ 11). (c) RT-quantitative PCR (RT-qPCR) analysis of the specified mRNAs in TO(krasG12V)T/+ micro-dissected livers of the indicated ahctf1 and tp53 genotypes (n = 3 biological replicates). Data are expressed as mean ± standard error of the mean (SEM). Significance was calculated using a one-way analysis of variation (ANOVA) with Tukey’s multiple comparisons test.
ahctf1 heterozygosity amplifies cell death in dox-treated TO(krasG12V)T/+ hepatocytes in the presence and absence of Tp53.