
Fig. 3
- ID
- ZDB-IMAGE-220922-35
- Genes
- Publication
- Denans et al., 2022 - An anti-inflammatory activation sequence governs macrophage transcriptional dynamics during tissue injury in zebrafish
- All Figures
- Figures for Denans et al., 2022
|
Fig. 3
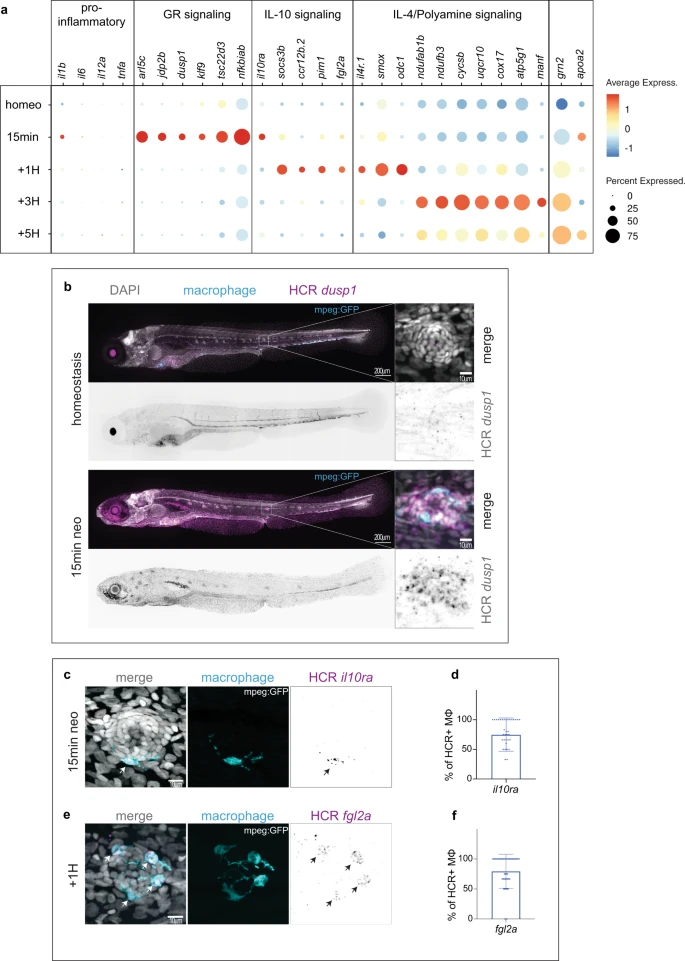
a Dot-Plot of selected differentially upregulated genes for each time point of the scRNA-seq time course within the effector population. b Representative confocal images (Maximum projection of a 200 μm z-stack) of an HCR-FISH for dusp1 in a 5dpf larvae (left) and zoom image of a representative neuromast (right) (from 6 whole larvae at 5dpf for homeostasis and 6 whole larvae at 5dpf after 15 min neo treatment. 2 biological replicates). c, e Representative confocal images (projection of a 30 μm z-stack) of HCR-FISH within the effector macrophages (arrows) for (c) il10ra, (e) fgl2a. d, f Quantifications of the percentage of HCR + effector macrophages (MΦ) for (d) il10ra, (f) fgl2a. (12 larvae with 3 neuromasts per larva and 3 biological replicates). For all graphs, data are represented as mean ± SD.