
IMAGE
Fig. 6
- ID
- ZDB-IMAGE-220628-91
- Genes
- Publication
- Sun et al., 2022 - Eucommia ulmoides Olive Male Flower Extracts Ameliorate Alzheimer's Disease-Like Pathology in Zebrafish via Regulating Autophagy, Acetylcholinesterase, and the Dopamine Transporter
- All Figures
- Figures for Sun et al., 2022
Image
|
Figure Caption
Fig. 6
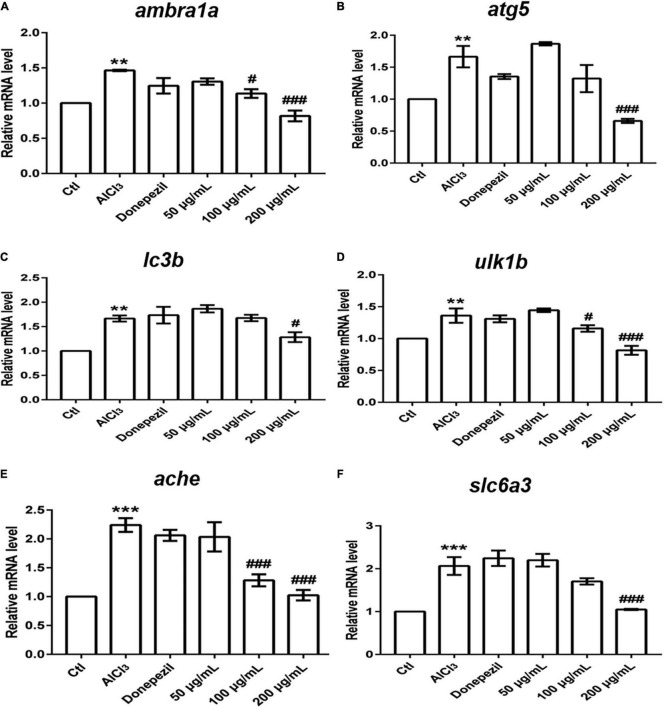
Transcriptional alterations of genes. The amount of gene expression was exhibited as the relative expression (shown as fold) compared with the Ctl. (**P < 0.01, ***P < 0.001 vs. Ctl; #P < 0.05, ###P < 0.001 vs. AlCl3). (A–D) Expressions of genes involved in autophagy. (E) Transcript levels of ache. (F) Transcript levels of slc6a3.
Figure Data
Acknowledgments
This image is the copyrighted work of the attributed author or publisher, and
ZFIN has permission only to display this image to its users.
Additional permissions should be obtained from the applicable author or publisher of the image.
Full text @ Front. Mol. Neurosci.