
IMAGE
Fig. 4.
- ID
- ZDB-IMAGE-220305-19
- Genes
- Publication
- Baronio et al., 2021 - Abnormal brain development of monoamine oxidase mutant zebrafish and impaired social interaction of heterozygous fish
- All Figures
- Figures for Baronio et al., 2021
Image
|
Figure Caption
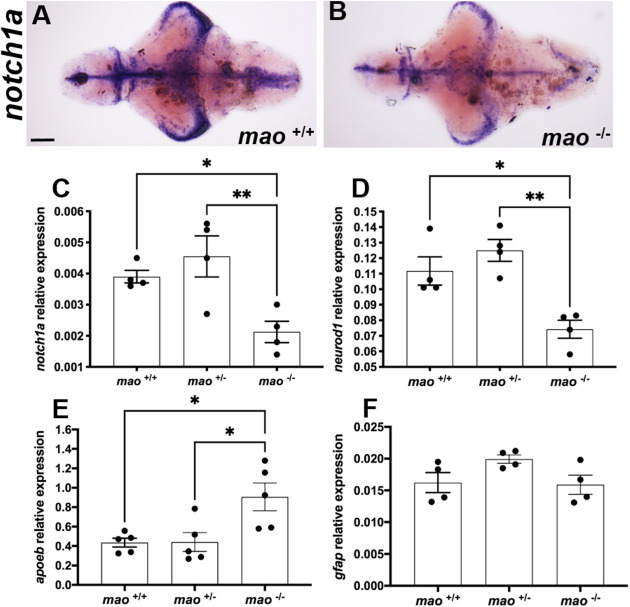
Fig. 4. mao−/− larvae exhibit altered expression of developmental markers. (A,B) Ventral views of whole-mount 10 dpf mao+/+ (A) and mao−/− (B) larval brains, anterior to the left, processed for notch1a RNA ISH. n=4 for each genotype. (C-F) Bar charts showing results from RT-qPCR analysis of notch1a (C), neurod1 (D), apoeb (E) and gfap (F) in larvae of the indicated genotype at 10 dpf. n=4 for each genotype. Data are mean±s.e.m. One-way ANOVA followed by Tukey's multiple comparisons test for statistical analysis. *P<0.05, **P<0.01. Scale bar: 75 μm.
Figure Data
Acknowledgments
This image is the copyrighted work of the attributed author or publisher, and
ZFIN has permission only to display this image to its users.
Additional permissions should be obtained from the applicable author or publisher of the image.
Full text @ Dis. Model. Mech.