
FIGURE 1
- ID
- ZDB-IMAGE-220205-16
- Genes
- Publication
- Song et al., 2022 - Disruption of Epidermal Growth Factor Receptor but Not EGF Blocks Follicle Activation in Zebrafish Ovary
- All Figures
- Figures for Song et al., 2022
|
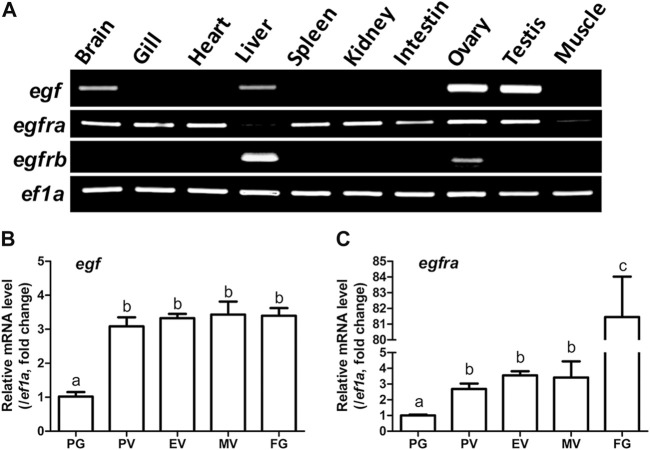
FIGURE 1 Tissue distribution of egf, egfra, and egfrb, and temporal expression profiles of egf and egfra during folliculogenesis. (A) RT-PCR analysis showed that egf was mainly expressed in the ovary and testis with weak expression in the brain, liver, and gill, whereas egfra was expressed in all organs, but with low levels in the liver and muscle. In contrast, egfrb was exclusively expressed in the liver and ovary with higher level in the liver. (B,C) The expression of egf and egfra mRNA was low in the PG follicles and increased significantly in the PV follicles. The mRNA level of egf maintained relatively constant after PV stage, whereas the expression of egfra showed a second surge in FG follicles prior to maturation. The expression levels of target genes were normalized to that of housekeeping gene ef1a, and expressed as fold change compared with that in PG follicles. Different letters indicate statistical significance (n = 3). PG, primary growth; PV, previtellogenic; EV, early vitellogenic; MV, mid-vitellogenic; FG, full-grown. EGF/egf, epidermal growth factor; EGFR/egfr, epidermal growth factor receptor.