
|
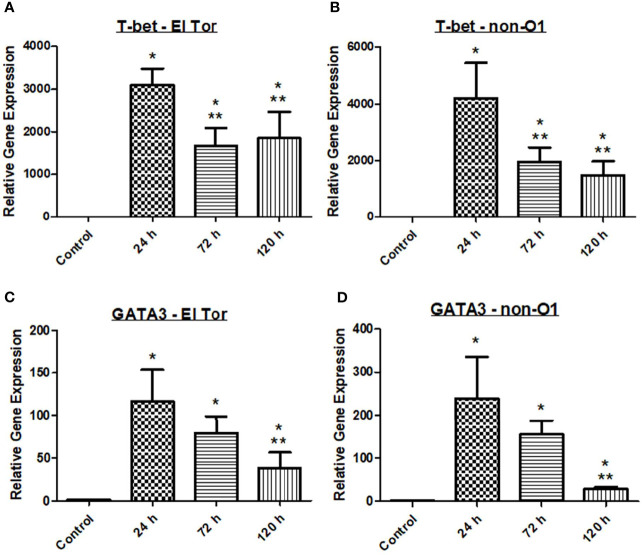
Figure 1
Adaptive immune responses in zebrafish against V. cholerae infection. WT zebrafish (n=5) were infected with E7946 (El Tor) or 25493 (non-O1) strains of V. cholerae at 2.5 x 10⁷ CFU/mL and then sacrificed at the indicated time points. (A) T-bet expression in fish infected with El Tor strain E7946. (B) T-bet expression in fish infected withnon-O1 strain 25493. (C) GATA3 expression in fish infected with El Tor strain E7946. (D) GATA3 expression in fish infected with non-O1 strain 25493. T-bet and GATA3 gene expression levels in zebrafish mRNA were determined through qRT-PCR. Gene expression was normalized against β-actin and expressed as fold change. Error bars indicate standard deviation. Data shown is from three experiments. *P < 0.05 as compared to control, **P < 0.05 as compared to 24 h infection.