
FIGURE 1
- ID
- ZDB-IMAGE-211002-13
- Genes
- Publication
- Peña et al., 2021 - Differential Requirement of Gata2a and Gata2b for Primitive and Definitive Myeloid Development in Zebrafish
- All Figures
- Figures for Peña et al., 2021
|
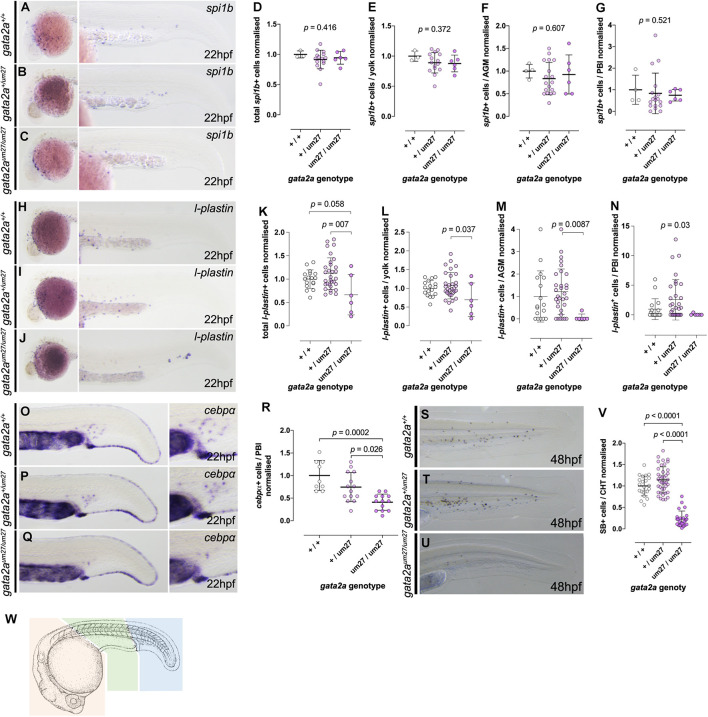
FIGURE 1 Primitive myeloid development in gata2a mutants at 22 hpf. (A–C) Expression of spi1b by in situ hybridization in 22 hpf embryos. (A–C) Lateral views of the head of the embryos (left) and lateral views of the tails (right), showing normal numbers of myeloid cells. (D–G) Quantifications of total (D) spi1b+ cells, and in the yolk (E), AGM (F), and the PBI (G). (H–J) Expression of l-plastin by in situ hybridization in 22 hpf embryos. (H–J) Lateral views of the head of the embryos (left) and lateral views of the tails (right) show decreased l-plastin+cells in gata2aum27/um27 homozygotes. (K–N) Quantifications of l-plastin+cells in the whole embryo (K), in the yolk (L), AGM (M), and the PBI (N). (O–Q) Lateral views showing cebpa expression in the tail (left) and PBI (right) in 22 hpf embryos. (R) Quantification of cebpa+ cells in the PBI of Gata2aum27 mutants. (S–U) Lateral views of 48 hpf mutant embryos stained with SB, which labels granulocytes. (V) Quantification of SB+ cells in the CHT of 48 hpf embryos shows decreased number of granulocytes in gata2aum27/um27 homozygotes. (W) Cartoon scheme of location of cells counted in these studies. Orange region = yolk, Green = AGM, blue = PBI. Camera lucida image modified from Kimmel et al. (1995).