
Figure 6
- ID
- ZDB-IMAGE-210930-10
- Genes
- Publication
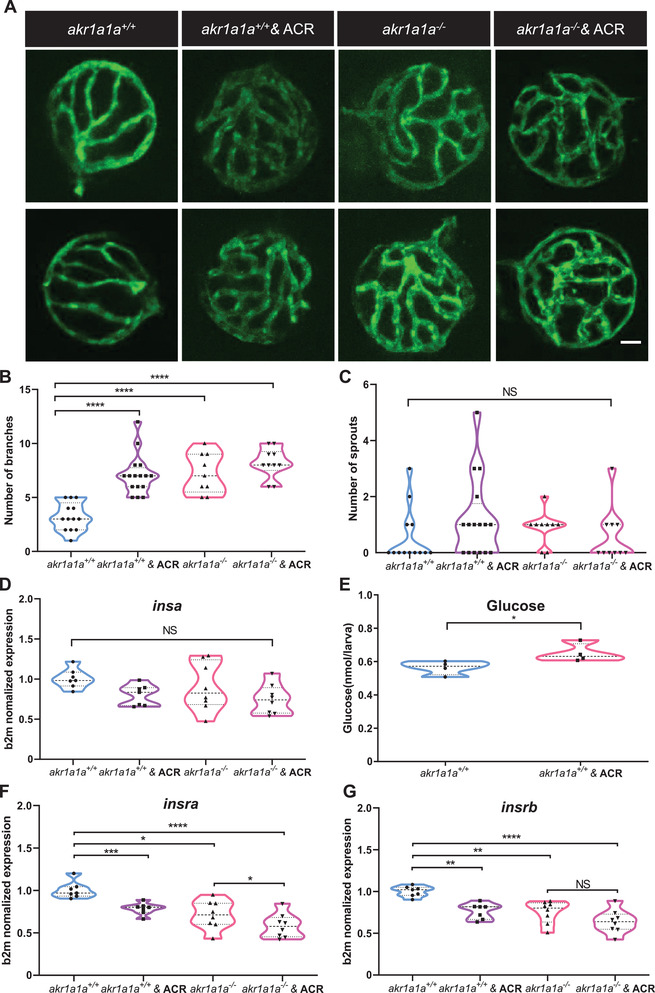
- Qi et al., 2021 - Reduced Acrolein Detoxification in akr1a1a Zebrafish Mutants Causes Impaired Insulin Receptor Signaling and Microvascular Alterations
- All Figures
- Figures for Qi et al., 2021
|
Figure 6
ACR induced alterations on retinal hyaloid vasculature and downregulation of