
Figure 1
- ID
- ZDB-IMAGE-201003-155
- Genes
- Publication
- Weger et al., 2020 - MondoA regulates gene expression in cholesterol biosynthesis-associated pathways required for zebrafish epiboly
- All Figures
- Figures for Weger et al., 2020
|
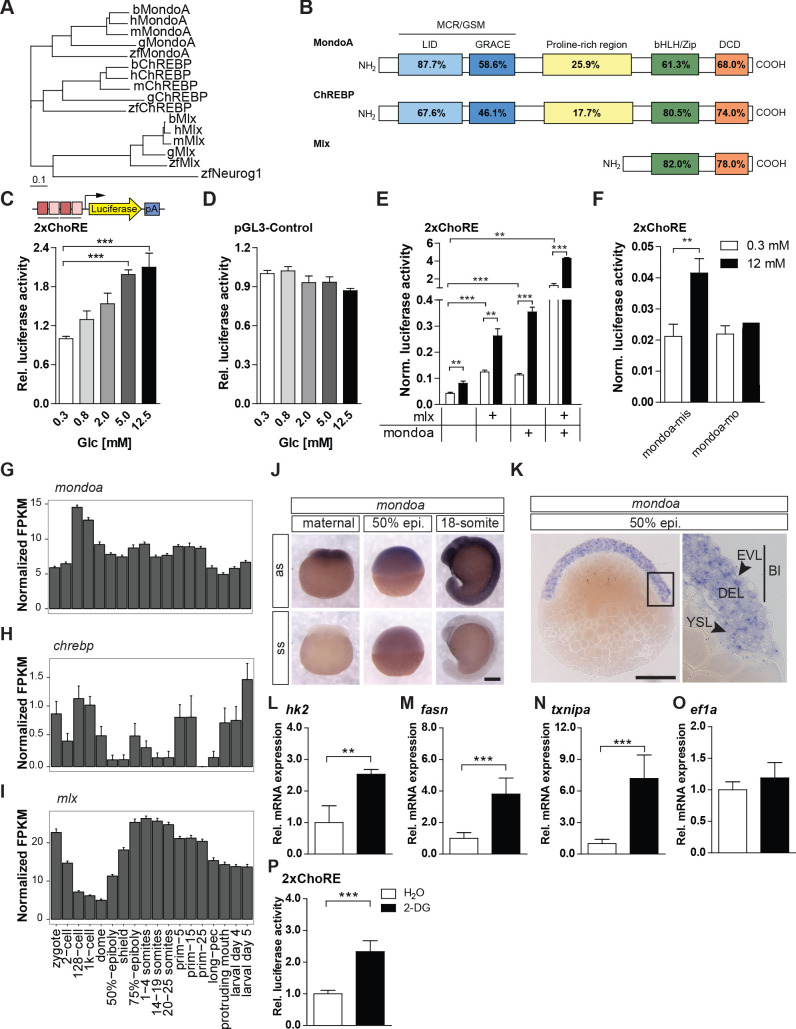
Figure 1 (A) Phylogenetic tree of ChREBP, MondoA and Mlx proteins. h, human, m, mouse, b, bovine, g, chicken, zf, zebrafish. Outgroup: zf Neurogenin 1 (Neurog 1). Scale bar: 0.1 estimated amino acid substitutions per site. (B) Amino acid identities in % between zebrafish and human domains of ChREBP, MondoA and Mlx: ‘Mondo conserved regions/glucose-sensing module’ (MCR/GSM); ‘low-glucose inhibitory domain’ (LID; light blue); ‘glucose-response activation conserved element’ (GRACE; dark blue); ‘basic-helix-loop-helix/leucine zipper’ (bHLH/ZIP; green); ‘dimerization and cytoplasmic localization domain’ (DCD; red). (C, D) Bioluminescence levels after 24 hr of glucose treatment of PAC2 cells transiently transfected with the 2xChoRE reporter consisting of a luciferase reporter gene (yellow) regulated by a minimal promoter (TATA; arrow) and two carbohydrate response elements (ChoREs; each with the sequence 5’-CACGCG-N5-CTCGTG-3’; pA for polyadenylation site; n = 4, (C) or with the constitutively expressed pGL3-Control reporter construct (D, n = 4). (E, F) Bioluminescence levels in 2xChoRE reporter expressing PAC2 cells upon 24 hr of treatment with 0.3 mM (white bars) or 12 mM (black bars) glucose after overexpression of MondoA and/or Mlx (E, n = 4) or transfection with mondoa-mo or mondoa-mis (F, n = 8). Data were normalized to Renilla luciferase activity (Norm. bioluminescence). (G–I) mRNA expression profiles of mondoa (G), chrebp (H) and mlx (I) during zebrafish developmental stages from zygote to larval stage five extracted from a published dataset (White et al., 2017). n = 20; FKPM, Fragments Per Kilobase of transcript per Million mapped reads. (J) WISH of mondoa transcripts at zygote (maternal), 50% epiboly (50% epi.) and 18-somite stages. as, antisense probe, ss, sense probe. Scale bar: 0.2 mm. (K) Epon sections of 50% epi. embryos showed mondoa expression in the enveloping layer (EVL), the deep cell layer (DEL) of the blastoderm (Bl) and the yolk syncyctial layer (YSL). Scale bar: 0.2 mm, for higher magnification 50 µm. (L–O) Glucose induction of Mondo pathway target gene expression in early zebrafish embryos. Embryos were injected with the glucose analog 2-deoxy-D-glucose (2-DG; black bars) or with water (white bars) as a control. RNA was extracted at the sphere stage to perform RT-qPCR of genes known to be Mondo pathway targets in mammals: hexokinase 2 (hk2, L), fatty acid synthase (fasn, M), thioredoxin-interacting protein a (txnipa, N), eukaryotic translation elongation factor 1 alpha 1 (ef1a, O) (n = 9). (P) Embryos (n ≥ 72) injected with the 2xChoRE reporter showed increased bioluminescence at sphere stage when co-injected with 2-DG. Error bars represent SEM; *, p≤0.05; **, p≤0.01; ***, p≤0.001.