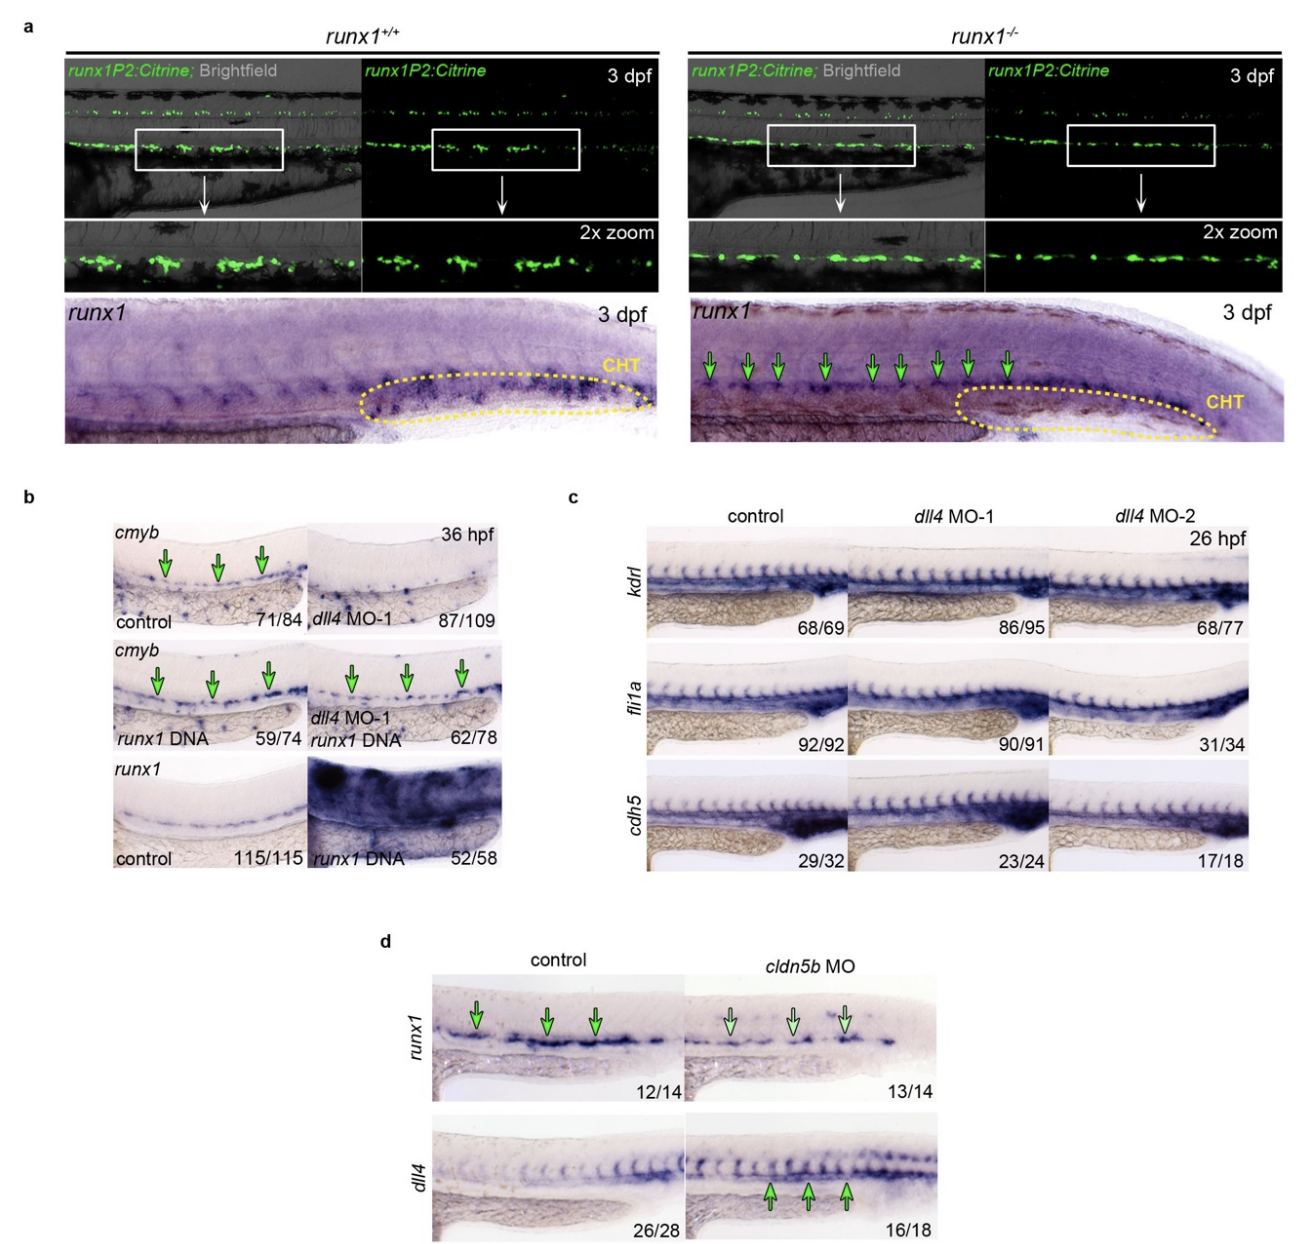
Fig. S9 Representative fluorescent microscopy images highlighting the DA region of 3 dpf TgBAC(runx1P2:Citrine) embryos either on a runx1+/+ or runx1-/- genetic background. Magnifications highlight the boxed areas. Bottom: ISH analysis of runx1 in the trunk region of 3 dpf runx1+/+ and runx1-/- embryos. Green arrows point to expression in the HE. The region of the caudal haematopoietic tissue (CHT) is indicated. (b) Top and middle: ISH analysis of cmyb in dll4 MO-1 and control embryos co-injected with or without a runx1 over-expression construct. Green arrows point to the HE. Bottom: Expression of runx1 in control and runx1 over-expression embryos. (c) ISH analysis of endothelial genes kdrl, fli1a and cdh5 in control and dll4 MO embryos. Experiment was performed with two different MOs. (d) ISH analysis of runx1 and dll4 expression in control and cldn5b MO embryos
Image
Figure Caption
Figure Data
Acknowledgments
This image is the copyrighted work of the attributed author or publisher, and
ZFIN has permission only to display this image to its users.
Additional permissions should be obtained from the applicable author or publisher of the image.
Full text @ Nat. Commun.

