
Fig. 1
- ID
- ZDB-IMAGE-200319-1
- Genes
- Publication
- Marín-Juez et al., 2019 - Coronary Revascularization During Heart Regeneration Is Regulated by Epicardial and Endocardial Cues and Forms a Scaffold for Cardiomyocyte Repopulation
- All Figures
- Figures for Marín-Juez et al., 2019
|
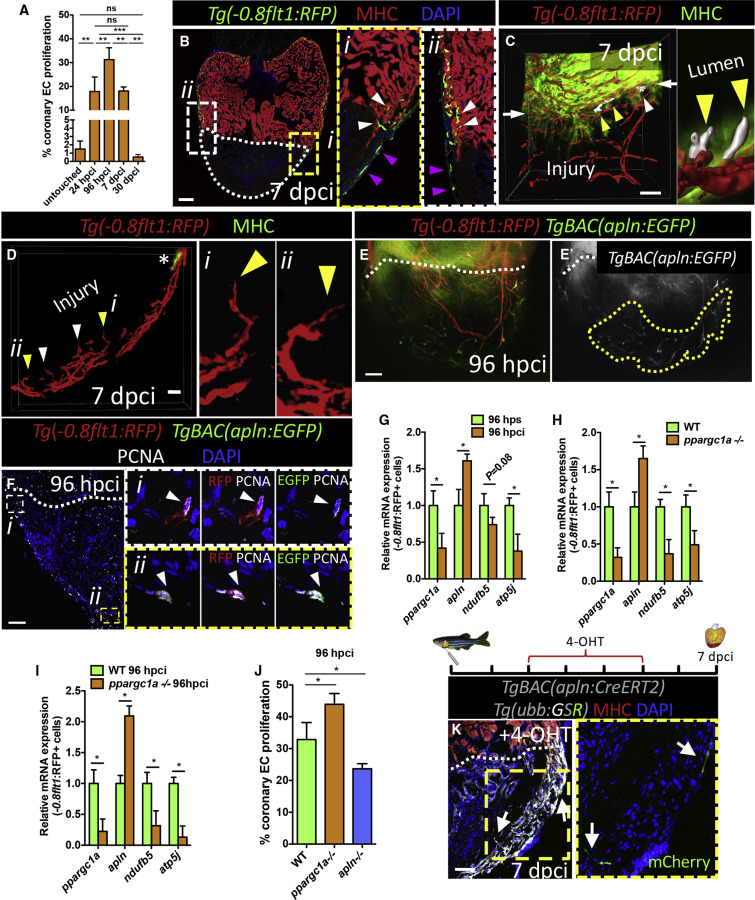
Fig. 1 Regenerating Coronaries Sprout Superficially and toward the Cardiac Lumen (A) cEC proliferation at different times after injury (n = 4 ventricles per time point). (B) Ventricle at 7 dpci stained for coronaries (green), CMs (red), and DNA (blue); (Bi, Bii) high-magnification images of coronary vessels sprouting into the ventricle (white arrowheads) and superficially (magenta arrowheads). (C and D) 3D image reconstructions of the injured area after tissue clearing and staining for coronaries (red) and CMs (green). (C) Luminal view of intra-ventricular coronary sprouting (arrowheads) in the border zone (white arrows). Sprouts (yellow arrowheads) shown in high magnification (n = 3). (D) Intra-ventricular sprouting vessels in the apex (arrowheads). High-magnification images of sprouts (yellow arrowheads) shown in i and ii (n = 3). Asterisk marks the border zone. (E) Tg(-0.8flt1:RFP); TgBAC(apln:EGFP) ventricle at 96 hpci. Yellow dotted line delineates the area with apln:EGFP+ coronaries (n = 6). (F) Ventricular section at 96 hpci stained for coronaries (red), apln:EGFP expression (green), PCNA (white), and DNA (blue). High-magnification images of coronary vessels sprouting intra-ventricularly (Fi, white arrowheads) and superficially (Fii, white arrowheads) (n = 6). (G) qPCR analysis of ppargc1a, apln, ndufb5, and atp5j mRNA levels in sorted -0.8flt1:RFP+ cECs at 96 h post-sham (hps) (n = 4) and 96 hpci (n = 4). (H) qPCR analysis of ppargc1a, apln, ndufb5, and atp5j mRNA levels in sorted -0.8flt1:RFP+ cECs from 8 months post-fertilization (mpf) untouched WT (n = 4) and ppargc1a−/− (n = 4) ventricles. (I) qPCR analysis of ppargc1a, apln, ndufb5, and atp5j mRNA levels in sorted -0.8flt1:RFP+ cECs from 8 months post-fertilization (mpf) WT (n = 4) and ppargc1a−/− (n = 4) ventricles at 96 hpci. (J) cEC proliferation in 8 mpf WT (n = 5), ppargc1a−/− (n = 5), and apln−/− (n = 5) ventricles. (K) Section of a TgBAC(apln:CreERT2); Tg(ubb:GSR) ventricle at 7 dpci stained for GFP (white), mCherry (green), CMs (red), and DNA (blue); right panel shows high-magnification image of recombined coronaries (white arrows) (n = 6). White dotted lines delineate injured area. Data in graphs expressed as mean ± SEM. ns, no significant difference, ∗p < 0.05, ∗∗p < 0.01, ∗∗∗p < 0.001. Scale bars: 50 μm. See also Figures S1–S3; Videos S1 and S2.
Reprinted from Developmental Cell, 51, Marín-Juez, R., El-Sammak, H., Helker, C.S.M., Kamezaki, A., Mullapuli, S.T., Bibli, S.I., Foglia, M.J., Fleming, I., Poss, K.D., Stainier, D.Y.R., Coronary Revascularization During Heart Regeneration Is Regulated by Epicardial and Endocardial Cues and Forms a Scaffold for Cardiomyocyte Repopulation, 503-515.e4, Copyright (2019) with permission from Elsevier. Full text @ Dev. Cell