
Figure 6
- ID
- ZDB-IMAGE-200318-14
- Genes
- Publication
- Weinberger et al., 2020 - Functional Heterogeneity within the Developing Zebrafish Epicardium
- All Figures
- Figures for Weinberger et al., 2020
|
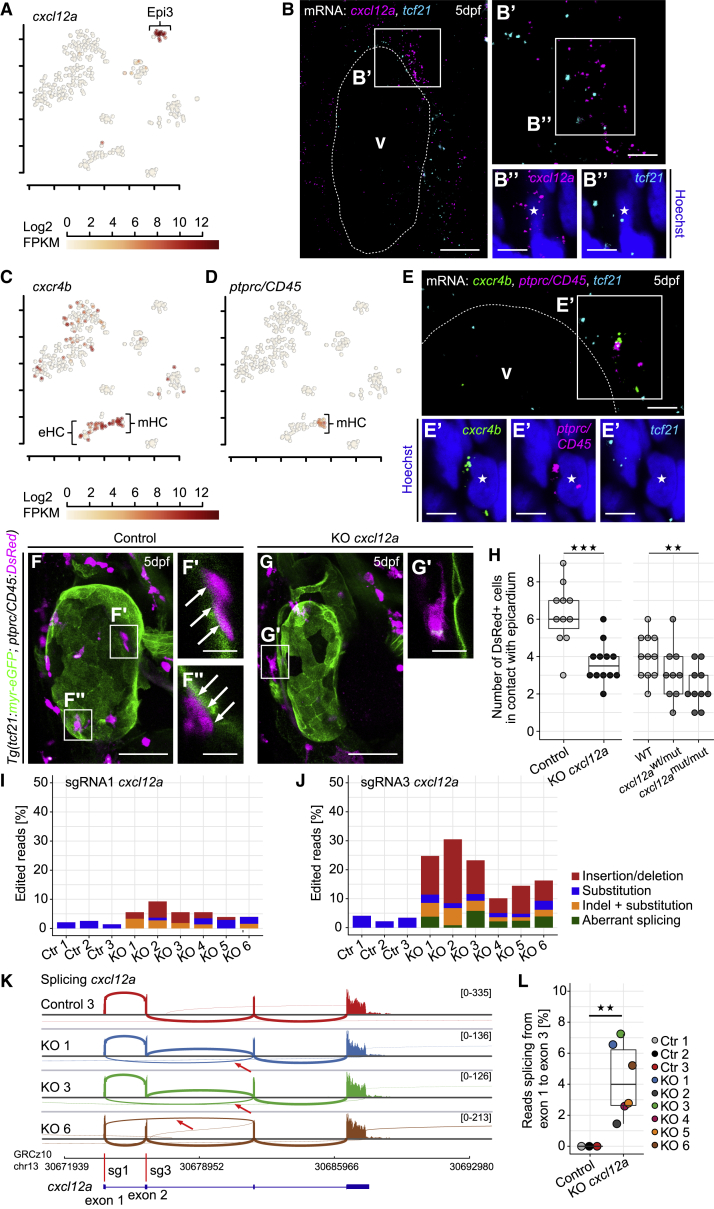
Figure 6
The Chemokine
(A) Expression of
(B) mRNA staining of
(C and D) Expression of
(E) mRNA staining of
(F) The heart in a 5 dpf control larva. (F′ and F″)
(G and G′) Fewer
(H) Absolute quantification of
(I and J) RNA-seq analysis of
(K) Sashimi plots showing splicing of
(L) Relative number of reads splicing from
Scale bars: 50 μm in (F) and (G); 20 μm in (B); 10 μm in (F′), (F″), and (G′), and 5 μm in (B′), (B″), (E), and (E′). Color channels were adjusted separately for brightness and contrast. (F) and (G) are projections; (B), (E), (F′), (F″), and (G′) are single optical sections. Data in (H) and (L) are represented as median, first, and third quartiles (box). Significance calculated using Welch’s t test. ∗∗p < 0.01, ∗∗∗p < 0.001. V, ventricle; eHC, erythroid hematopoietic cell; mHC, myeloid hematopoietic cell.
See also
Reprinted from Developmental Cell, 52(5), Weinberger, M., Simões, F.C., Patient, R., Sauka-Spengler, T., Riley, P.R., Functional Heterogeneity within the Developing Zebrafish Epicardium, 574-590.e6, Copyright (2020) with permission from Elsevier. Full text @ Dev. Cell