
Fig. 5
- ID
- ZDB-IMAGE-190910-23
- Genes
- Publication
- Bonkhofer et al., 2019 - Blood stem cell-forming haemogenic endothelium in zebrafish derives from arterial endothelium
- All Figures
- Figures for Bonkhofer et al., 2019
|
Fig. 5
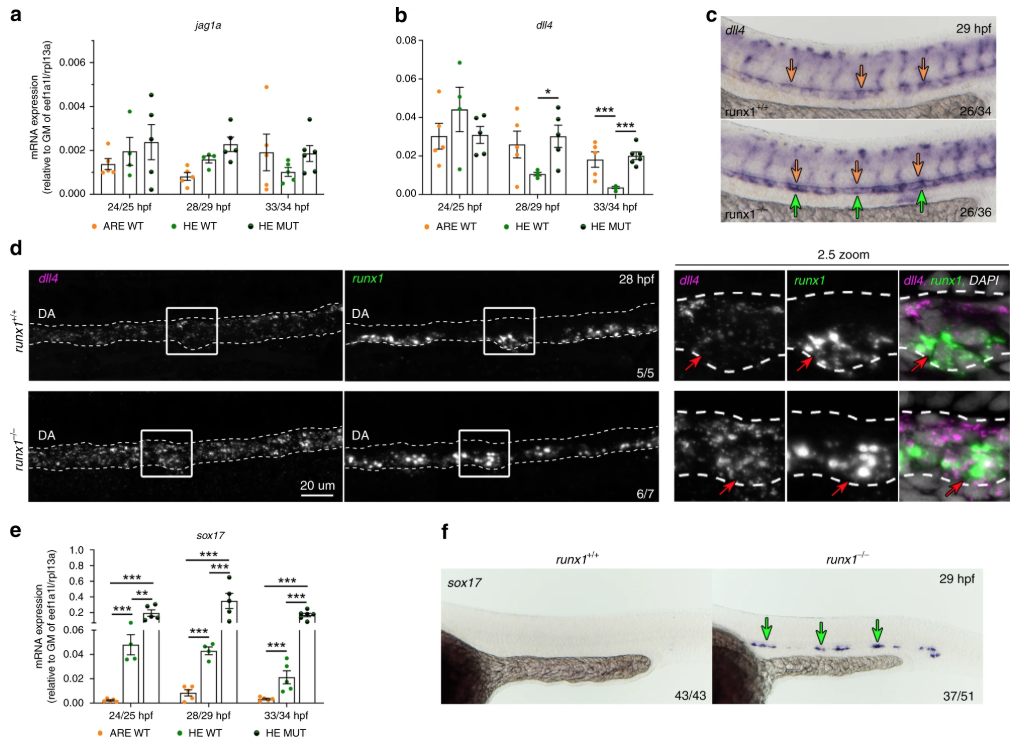
Expression of dll4 in aortic HE is repressed by Runx1. a, b qRT-PCR gene expression analysis of NOTCH ligands jag1a and dll4 in the HE and ARE of runx1+/+ (WT) and the HE of runx1−/− mutant (MUT) embryos. Graphs in (a), (b) and (e) show the mean of detected expression levels relative to the geometric mean (GM) of the two housekeeping genes eef1a1l and rpl13a. n = 5 independent biological experiments for WT embryos and n = 6 independent biological experiments for MUT embryos. Error bars represent the SEM. two-way ANOVA; *p < 0.05; **p < 0.01; ***p < 0.001. c Spatial analysis of gene expression of dll4 in runx1+/+ and runx1−/− embryos by ISH. Green arrows point to the HE. Orange arrows point to the DA roof. d Maximum intensity projection of representative confocal images of runx1+/+ and runx1−/− embryos with double FISH for dll4 and runx1. Red arrows in the close-up highlight the region of a runx1+ cell. e qRT-PCR gene expression analysis of sox17 in the HE and ARE of runx1+/+ (WT) and the HE of runx1−/− mutant (MUT) embryos. f ISH analysis of sox17 in runx1+/+ and runx1−/− embryos. Green arrows point to the HE