
|
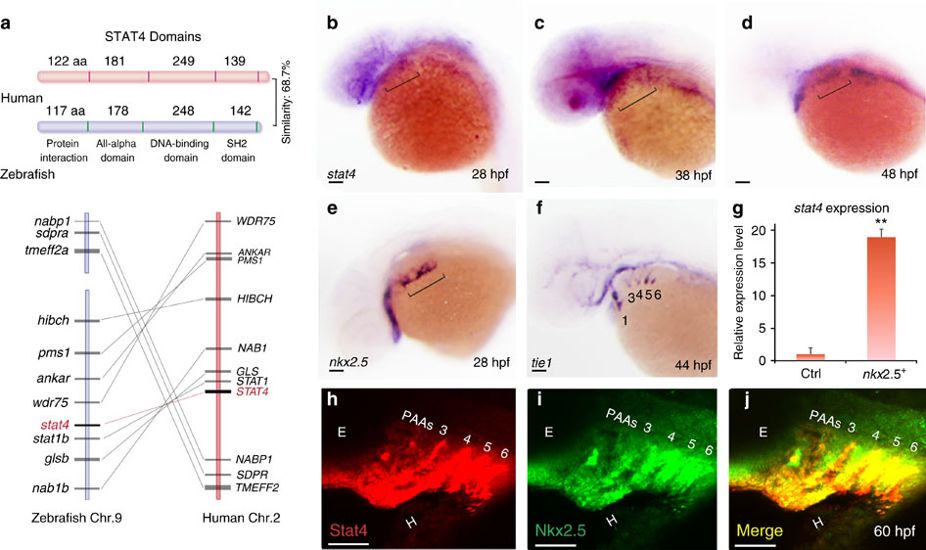
Fig. 1 Conservation of Stat4 and its expression in nkx2.5+ PAA endothelial progenitors.
(a) Schematic diagram illustrates the STAT4 protein functional domains of Human (red) and Zebrafish (blue), and synteny analysis of Stat4 loci on the human (red) and zebrafish (blue) chromosomes. The width of the lines and their distances represent the relative sizes of the genes and loci distances, respectively. (b–d) Brackets indicate that stat4 expression resides in the pharynx at 28 hpf (b), 38 hpf and 48 hpf (d) by in situ hybridization. (e) nkx2.5+ cells locate in the pharynx at 28 hpf (f) tie1+ cells at 44 hpf following the appearance of nkx2.5 pharyngeal clusters. (g) The expression level of stat4 in nkx2.5+ cells compared with somatic cells at 30 hpf from microarray data. Error bars indicate s.d., unpaired two-tailed Student’s t-test, **P=0.002 (triplicates for each group) (h,i) The immunohistochemistry staining of Stat4 (red) and Nkx2.5 (green) of wild-type embryos using anti-Stat4 and anti-Nkx2.5 antibodies at 60 hpf. (j) Co-localization of Stat4 and Nkx2.5 protein analysis by the merged image (yellow). Scale bars, 50 μm. n≥20 embryos per group for in situ, n=12 embryos per group for immunohistochemistry; hpf, hours post-fertilization.