
Fig. 4
- ID
- ZDB-IMAGE-190131-15
- Genes
- Publication
- Gibb et al., 2018 - Hey2 regulates the size of the cardiac progenitor pool during vertebrate heart development
- All Figures
- Figures for Gibb et al., 2018
|
Fig. 4
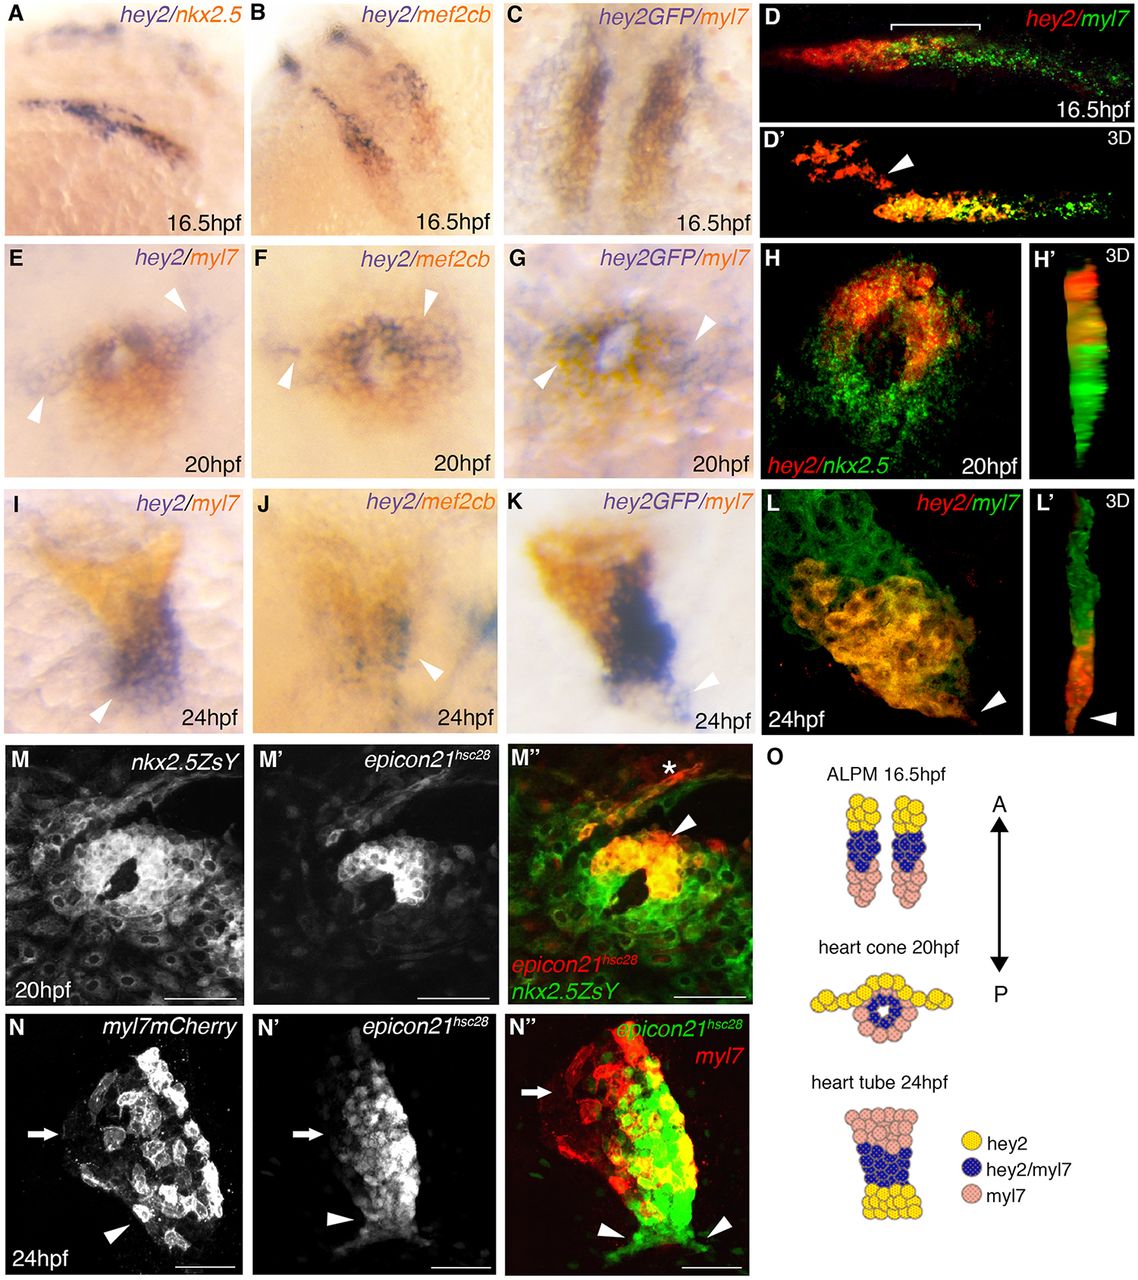
Expression of hey2 in CPCs during cardiac development. (A-L′) Double RNA in situ hybridization analysis of hey2 (A,B,D-F,H-J,L,L′) and Tg(epicon21:EGFP) expression (C,G,K) as compared with nkx2.5 (A,H,H′), myl7 (C-E,G,I,K-L′) and mef2cb (B,F,J) in wild-type embryos at 16.5 hpf (A-D), 20 hpf (E-H′) and 24 hpf (I-L′). The arrowheads in D',E-G indicate hey2+ cells outside of the cardiac (myl7+) region. (M-N″) Immunofluorescence showing Tg(epicon21:EGFP) enhancer expression when compared with Tg(nkx2.5:ZsYellow) at 20 hpf (M-M″) and Tg(myl7:mCherry-RAS) at 24 hpf (N-N″). (O) Schematic representation of hey2 and myl7 progenitor localization and movement patterns from 16.5 to 24 hpf. Scale bars: 50 µm. Asterisk labels pharyngeal mesoderm. Arrows indicate the atrium (N-N″) and arrowheads mark the ventricle (I-L′,N-N′).