
Fig. 9
- ID
- ZDB-IMAGE-180918-30
- Genes
- Publication
- Xing et al., 2018 - Mutational analysis of dishevelled genes in zebrafish reveals distinct functions in embryonic patterning and gastrulation cell movements
- All Figures
- Figures for Xing et al., 2018
|
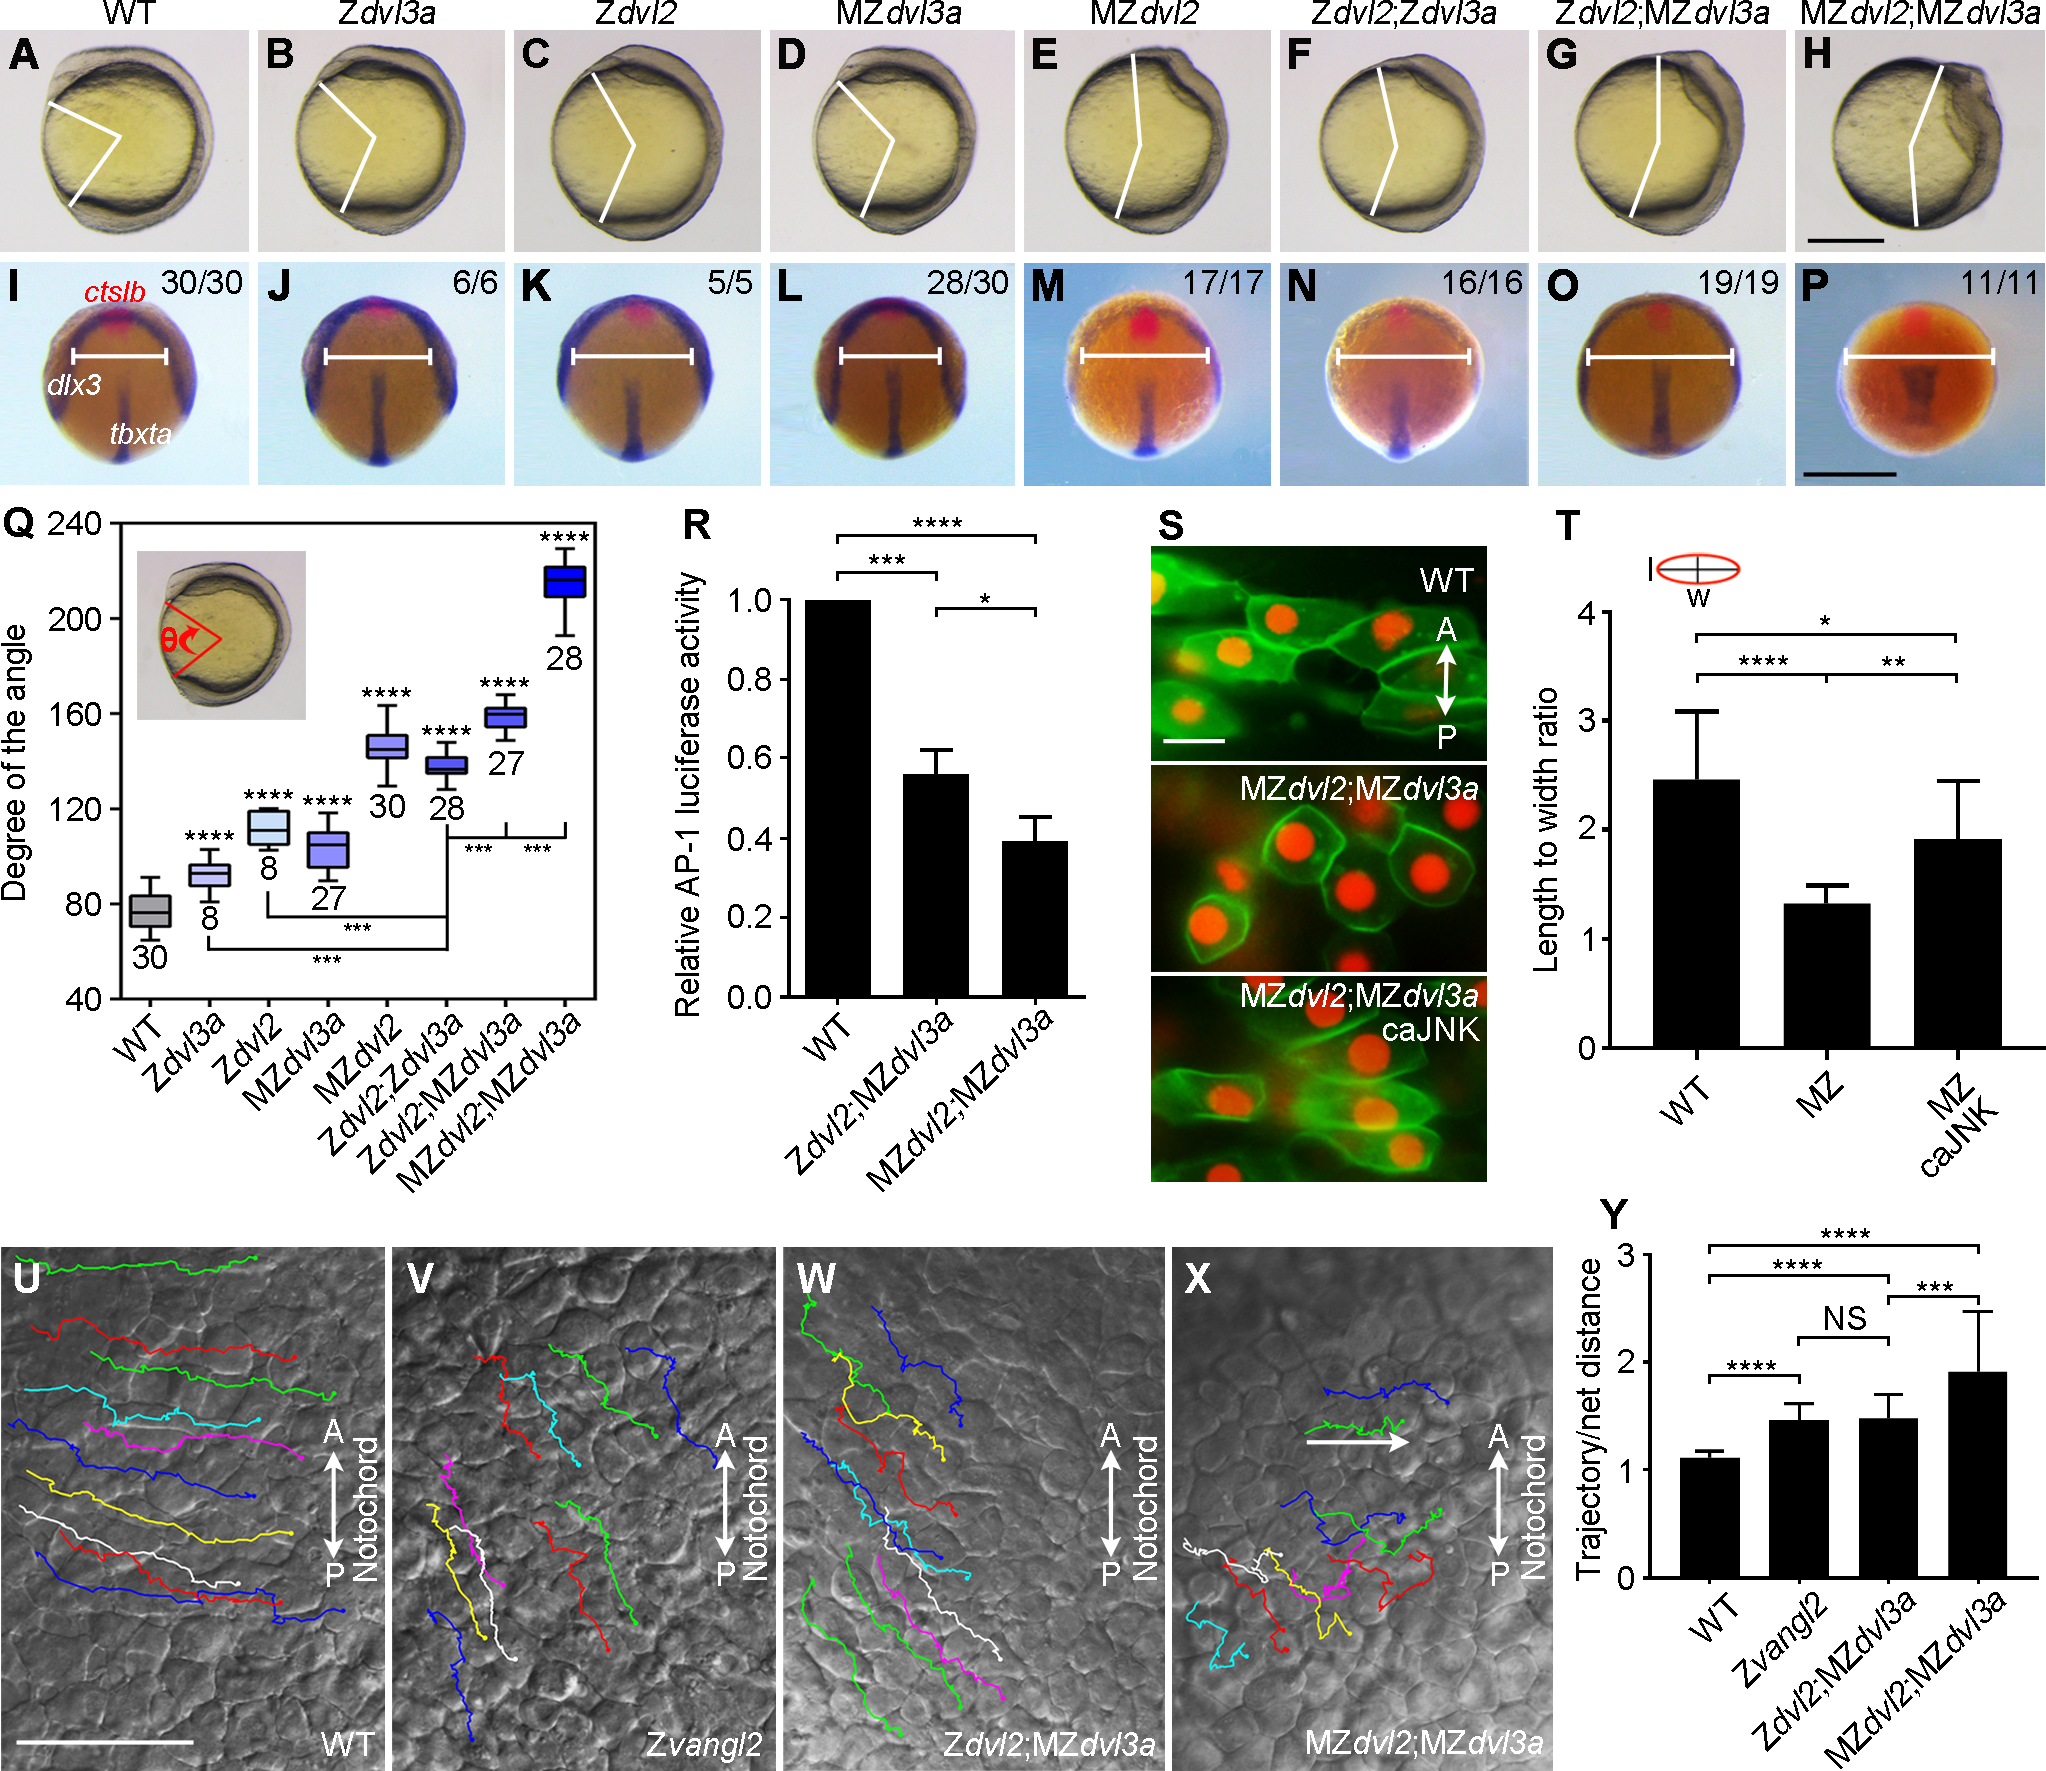
Fig. 9
Dvl2 and Dvl3a dosages in CE movements and Wnt/PCP signaling activity.
(A-H) Representative live images of WT and mutant embryos at 11.5 hpf. Lateral view, with anterior region on the top. (I-P) Dorsal view of indicated embryos simultaneously hybridized with ctslb, dlx3, and tbxta probes to reflect the position of prechordal plate mesoderm, neural plate borders, and notochord, respectively. MZdvl3a mutants were from intercrosses between dvl3a-/- carriers; MZdvl2 mutants were from crosses between female dvl2-/- fish and male dvl2+/- fish; Zdvl2;Zdvl3a mutants were from crosses between female dvl2+/-;dvl3a-/- fish and male dvl2+/-;dvl3a+/- fish; Zdvl2;MZdvl3a mutants were from intercrosses between dvl2+/-;dvl3a-/- carriers; MZdvl2;MZdvl3a mutants were from crosses between female mdvl2+(-)/-;dvl3a-/- fish and male dvl2+/-;dvl3a-/- fish. (Q) Statistical analysis shows that progressive reduction of Dvl2 and Dvl3a dosages increasingly aggravates axis extension defect. The embryos were imaged at 11.5 hpf, and genotyped before measuring the angle (inset). Bars represent the mean ± s.d. from indicated numbers of embryos collected from three independent experiments, and asterisks above the bars indicate significance with respect to WT embryos (***, P<0.001; ****, P<0.0001). (R) Reduced AP1 reporter activity in Zdvl2;MZdvl3a and MZdvl2;MZdvl3a mutants at 12 hpf. Bars represent the mean ± s.d. from three independent experiments (*, P<0.05, ***, P<0.001, ****, P<0.0001). (S) Rescue of cell polarity of MZdvl2;MZdvl3a mutant cells by caJNK. Vertical bidirectional arrows indicate AP orientation. (T) Statistical analysis of the length (l) to width (w) ratio in indicated cells. Bars represent the mean ± s.d. from at least 10 cells in two representative images (*, P<0.05, **, P<0.01, ****, P<0.0001). (U-X) Still frames from live time-lapse images show the dorsal convergence and movement behaviors of lateral cells in indicated embryos (see also S1–S4 Movies). The trajectories of 10 randomly selected cells are traced. (Y) Statistical analysis of the ratio between the trajectory and the net mediolateral distance (as indicated by a horizontal arrow). Bars represent the mean ± s.d. from at least 15 cells in two or three representative images (***, P<0.001; ****, P<0.0001). Scale bars: (A-H) 400 μm; (I-P) 400 μm; (S) 20 μm; (U-X) 50 μm.