
Fig. 4
- ID
- ZDB-IMAGE-180827-59
- Genes
- Publication
- Chrispijn et al., 2018 - Gene expression profile of a selection of Polycomb Group genes during zebrafish embryonic and germ line development
- All Figures
- Figures for Chrispijn et al., 2018
|
Fig. 4
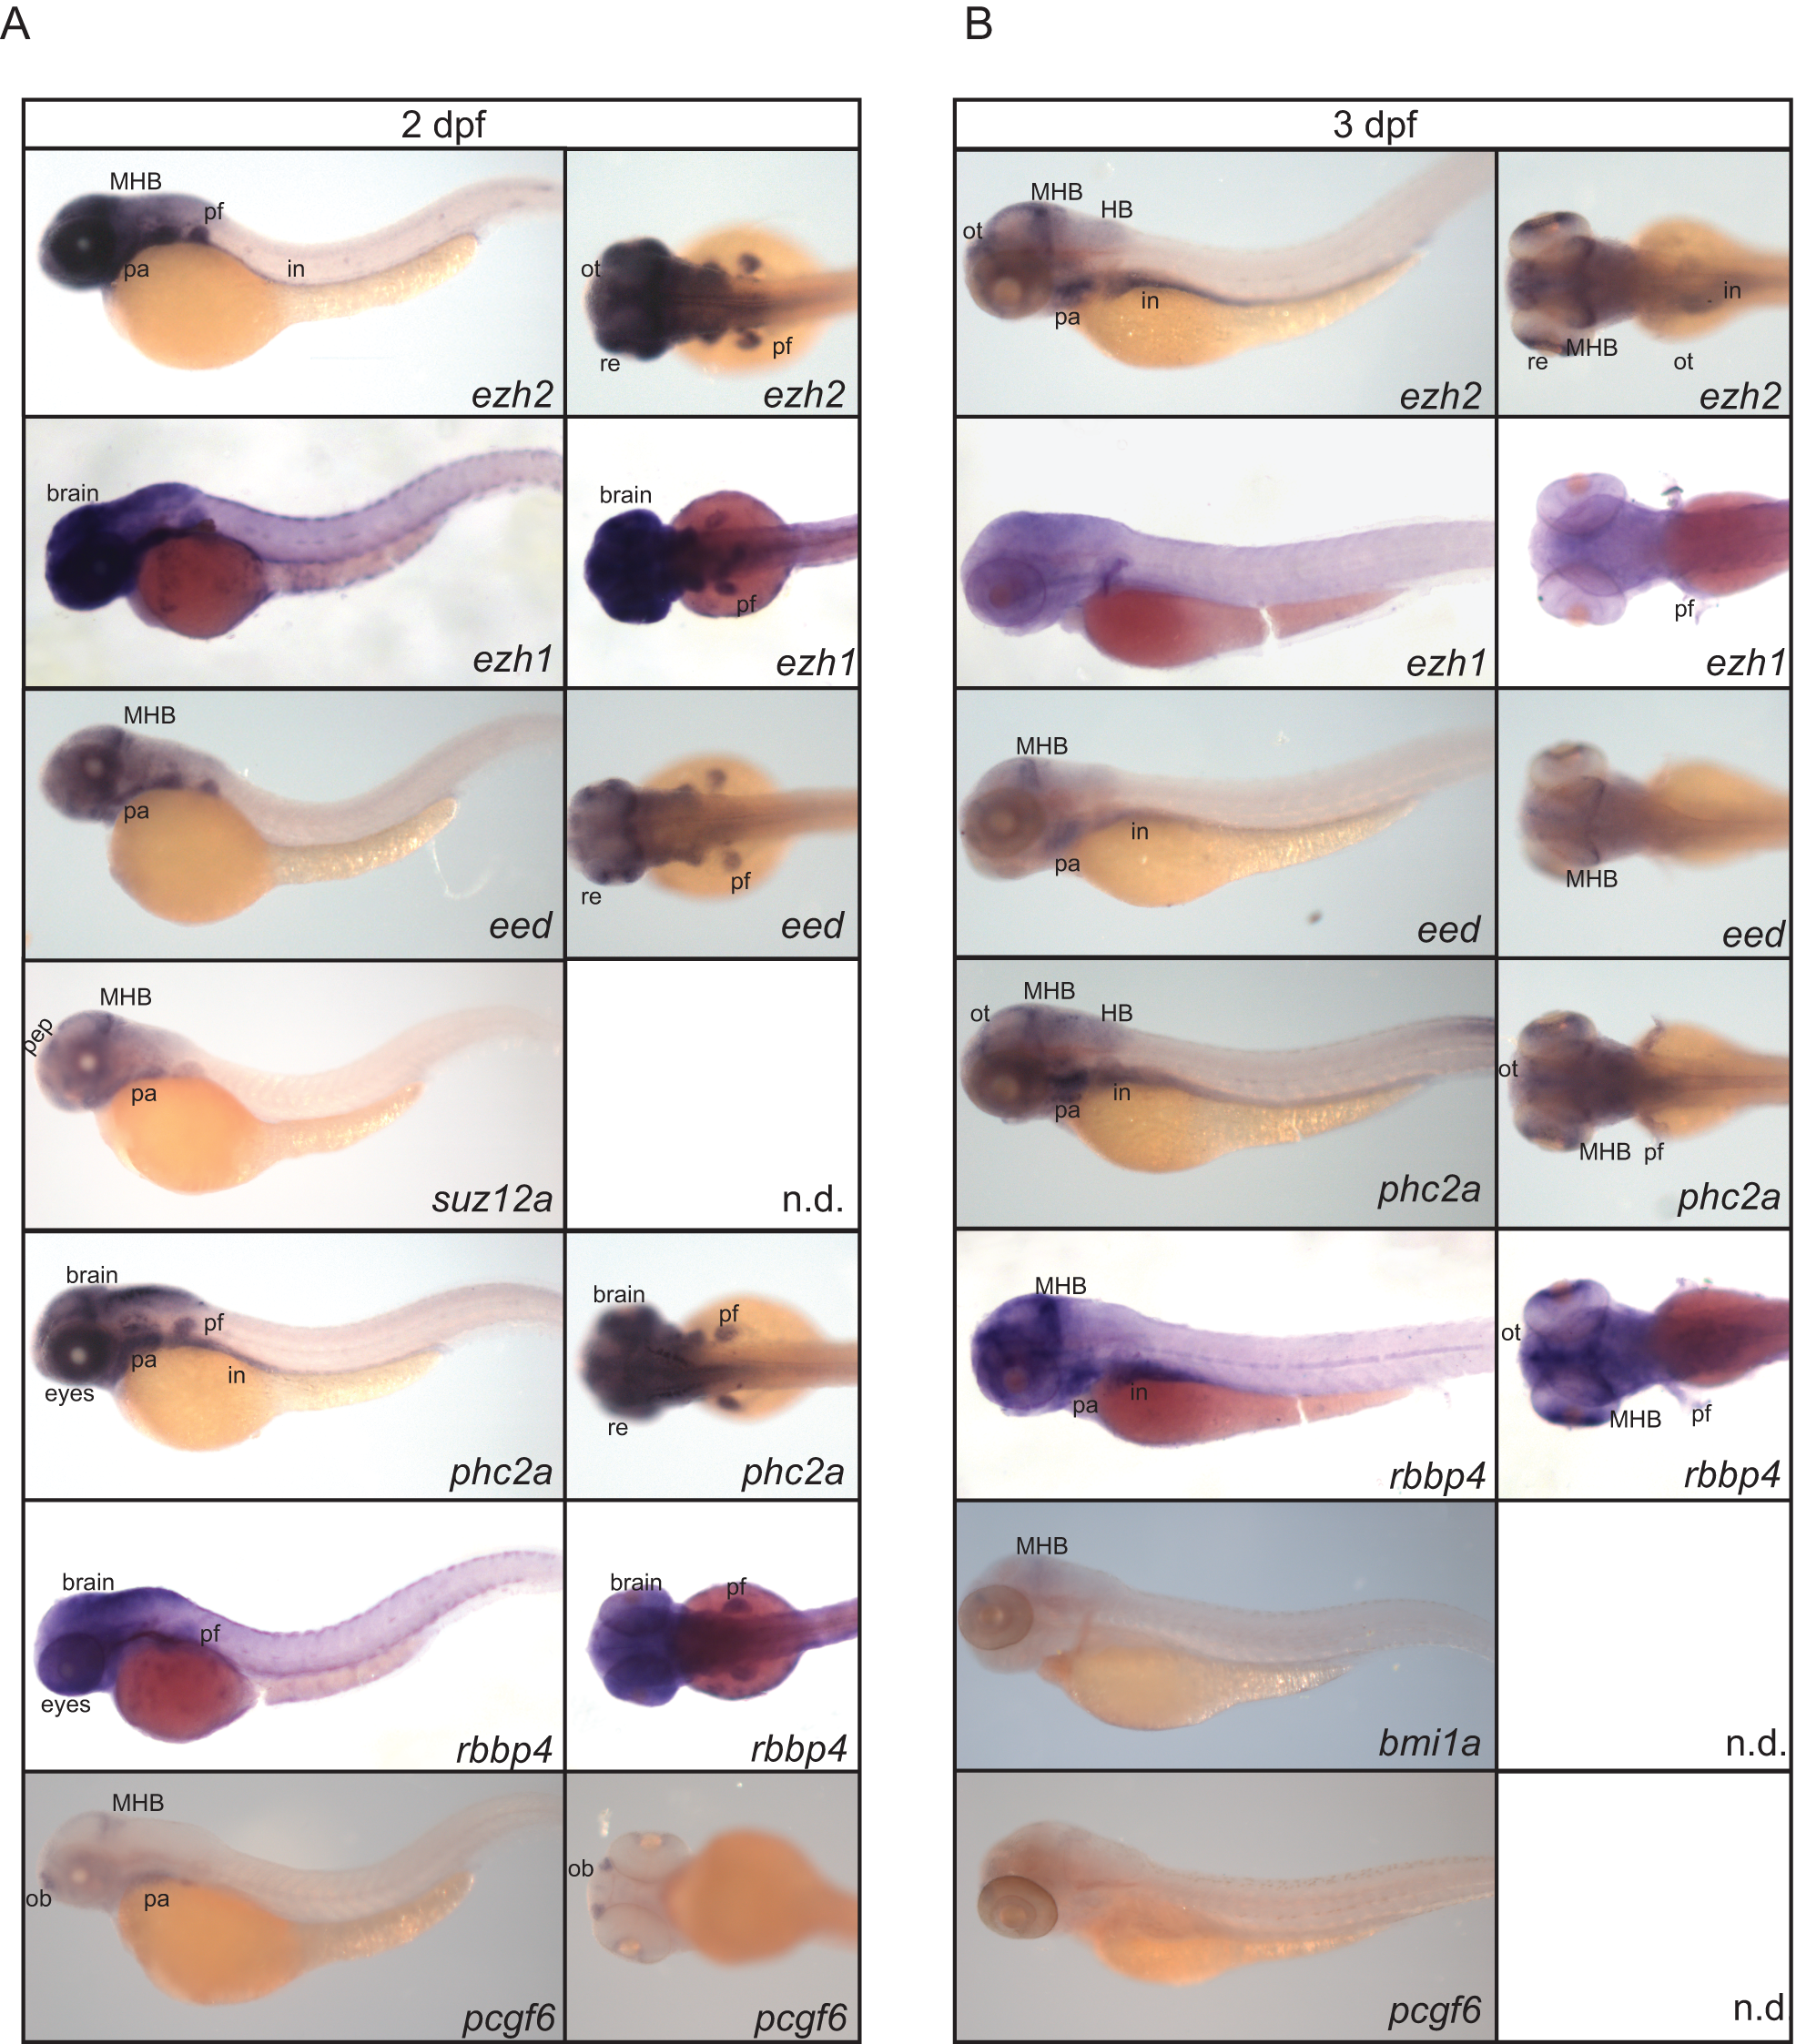
Expression of PcG genes at 2 and 3 dpf.
(A) Spatio-temporal expression assessed by whole mount in situ hybridization of ezh2, ezh1, eed, suz12a, phc2a, rbbp4, and pcgf6 at 2 dpf. Lateral views are shown for all genes. Dorsal views of ezh2, ehz1, eed, phc2a, and rbbp4. Ventral view of pcgf6. (B) Spatio-temporal expression assessed by whole mount in situ hybridization of ezh2, ezh1, eed, phc2a, rbbp4, bmi1a, and pcgf6 at 3 dpf. Lateral views are shown for all genes. Dorsal views of ezh2, ezh1, eed, phc2a, and rbbp4. in: intestine, pf: pectoral fin (buds), HB: hindbrain, MHB: mid-hind brain boundary, pep: presumptive epiphysis, pa: pharyngeal arches 3–7, ot: optic tectum, re: retina, ob: olfactory bulb, n.d. = no data.