
Fig. 1
- ID
- ZDB-IMAGE-180712-57
- Genes
- Publication
- Kidwell et al., 2018 - Multiple zebrafish atoh1 genes specify a diversity of neuronal types in the zebrafish cerebellum
- All Figures
- Figures for Kidwell et al., 2018
|
Fig. 1
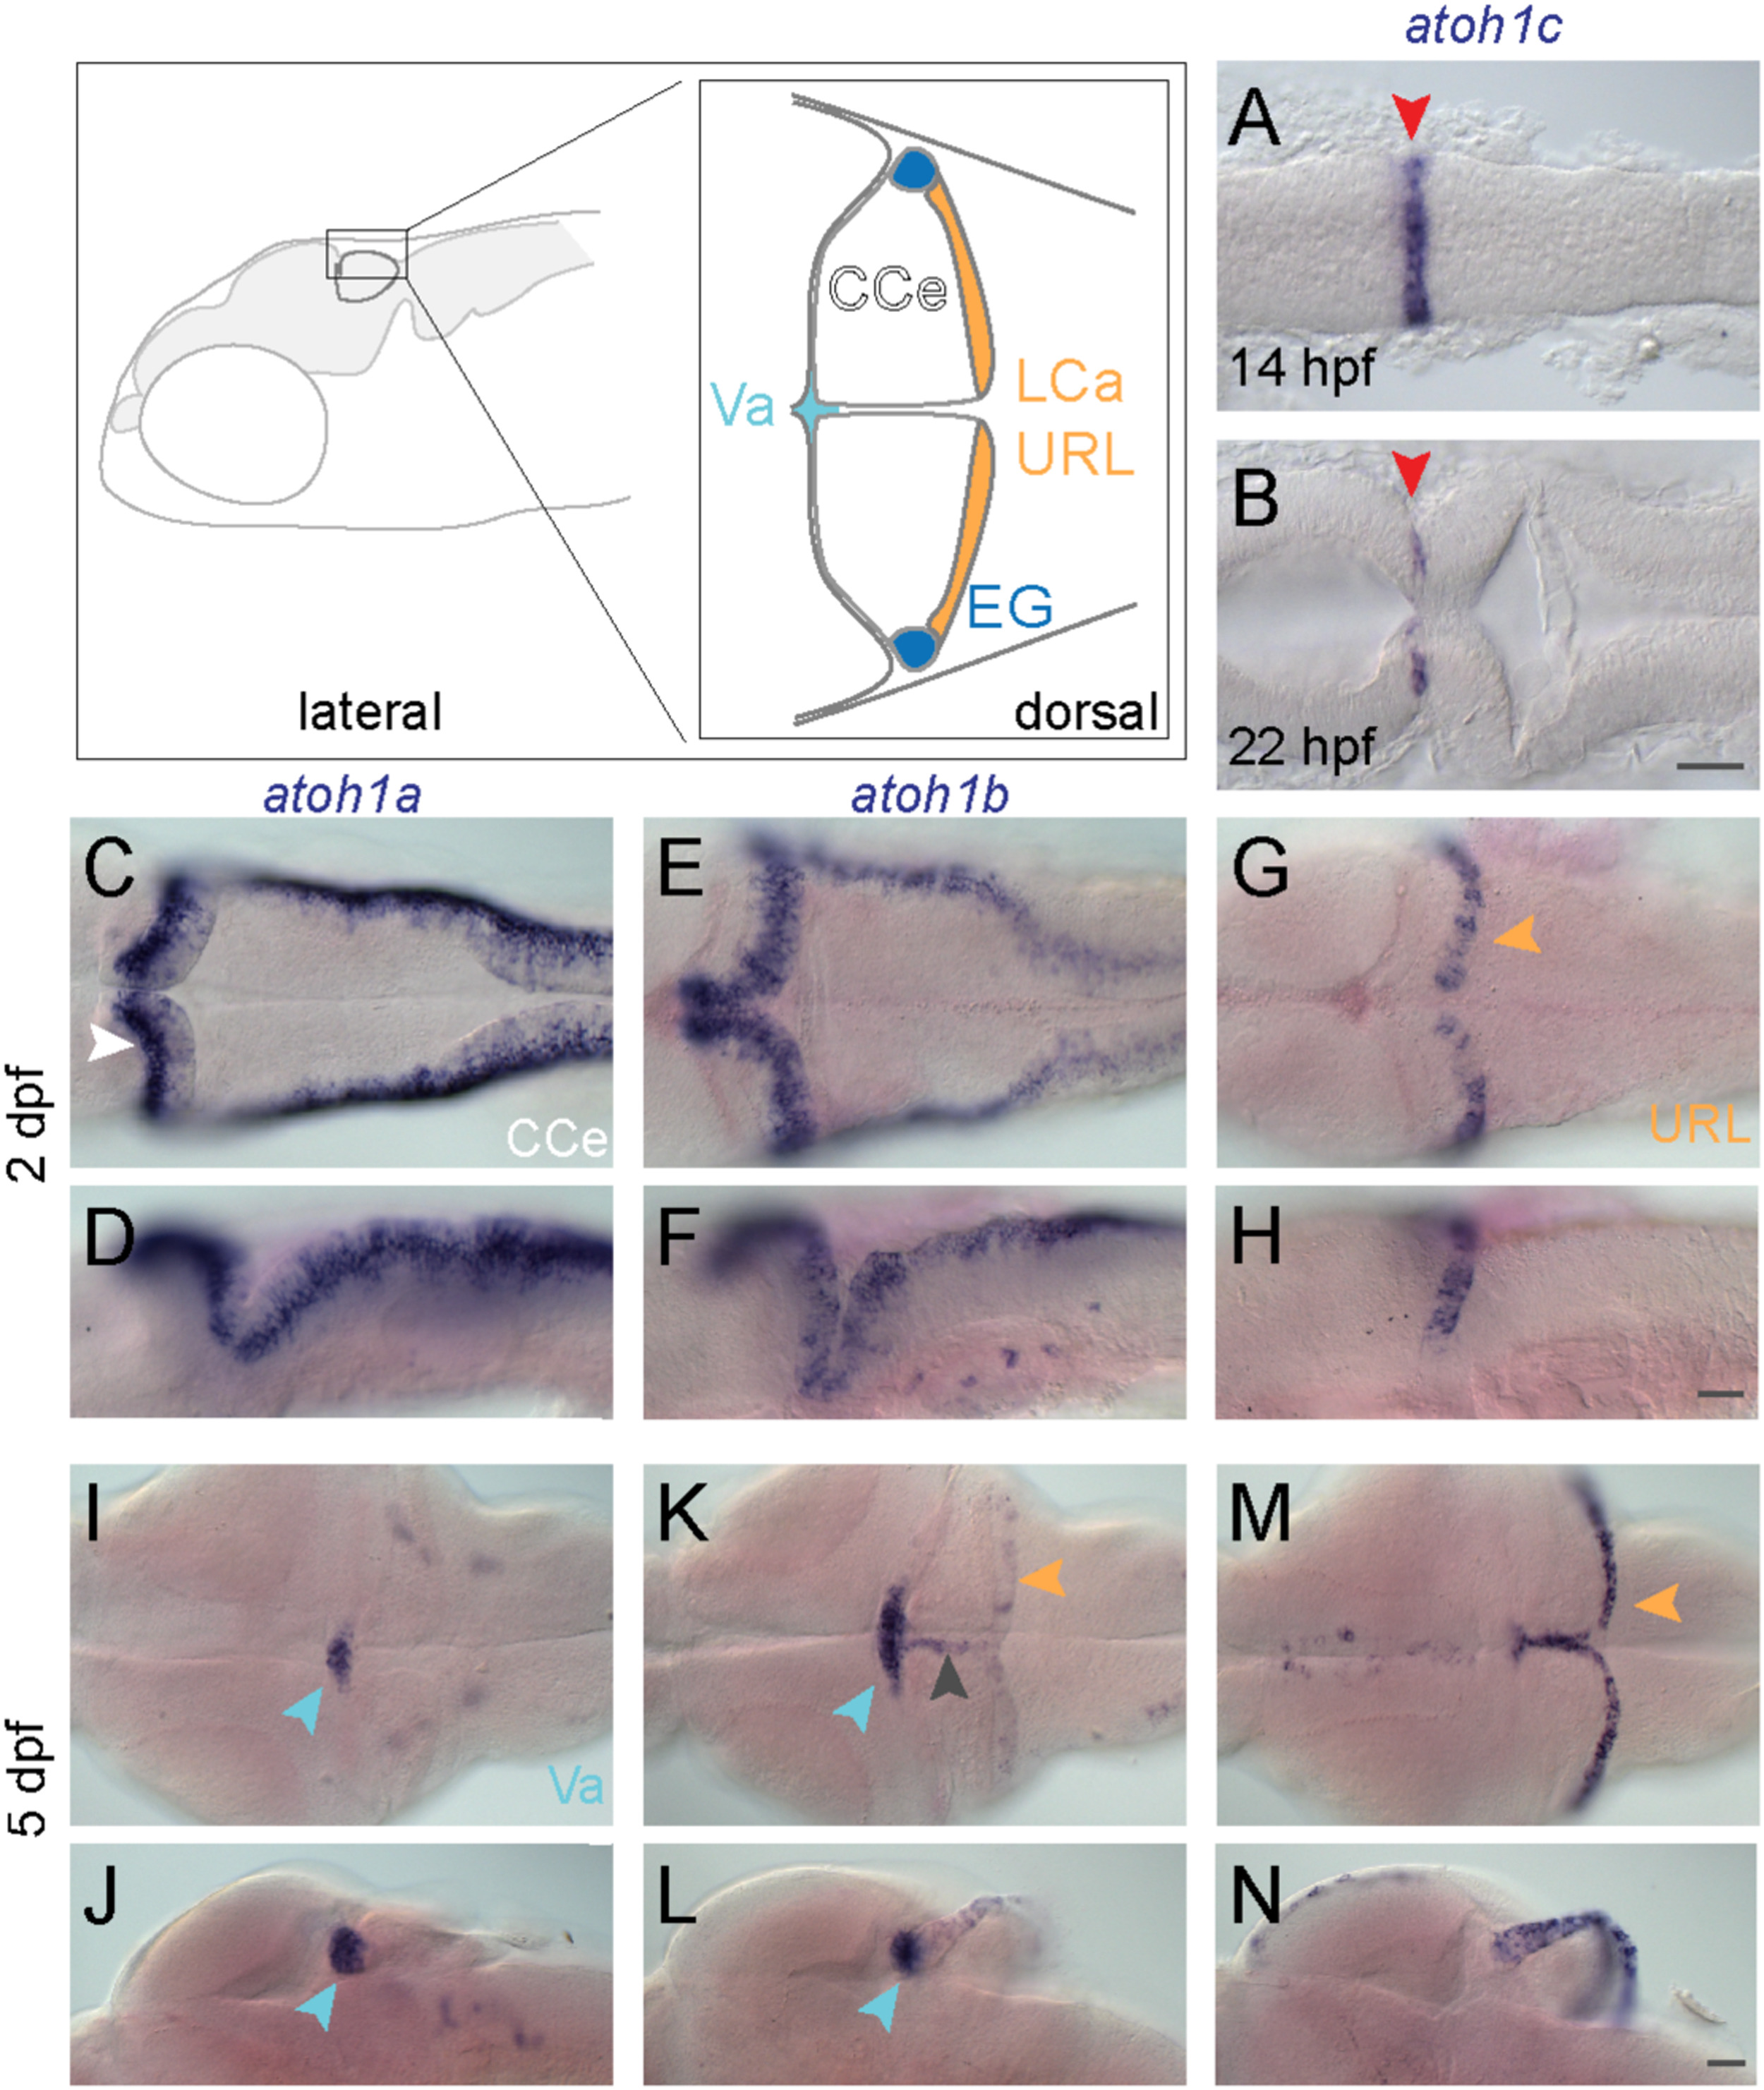
atoh1 gene expression in the developing zebrafish cerebellum. Schematic depicts regions of the zebrafish cerebellum in lateral (left panel) and dorsal (right panel) views at 5 dpf. Throughout the manuscript, white arrowheads indicate the CCe, light blue arrowheads indicate the Va, orange arrowheads indicate the URL (at early stages) or the LCa (at later stages) and dark blue arrowheads indicate the EG. Red arrowheads indicate the position of the MHB. A-N: RNA in situ hybridization in wild-type embryos with atoh1a (left column), atoh1b (middle column), and atoh1c (right column) at 14 hpf (A) 22 hpf (B), 2 dpf (C-H), and 5 dpf (I-N). Dorsal (A,B,C,E,G,I,K,M) or lateral (D,F,H,J,L,N) views are shown with anterior to the left. Gray arrowhead indicates midline of CCe. CCe, corpus cerebelli; EG, eminentia granularis; LCa, lobus caudalis cerebelli; URL, upper rhombic lip; Va, valvula cerebelli; Scale bars: 50 μM.
Reprinted from Developmental Biology, 438(1), Kidwell, C.U., Su, C.Y., Hibi, M., Moens, C.B., Multiple zebrafish atoh1 genes specify a diversity of neuronal types in the zebrafish cerebellum, 44-56, Copyright (2018) with permission from Elsevier. Full text @ Dev. Biol.