
Fig. 6
- ID
- ZDB-IMAGE-180627-34
- Genes
- Publication
- Sedykh et al., 2017 - Zebrafish Rfx4 controls dorsal and ventral midline formation in the neural tube
- All Figures
- Figures for Sedykh et al., 2017
|
Fig. 6
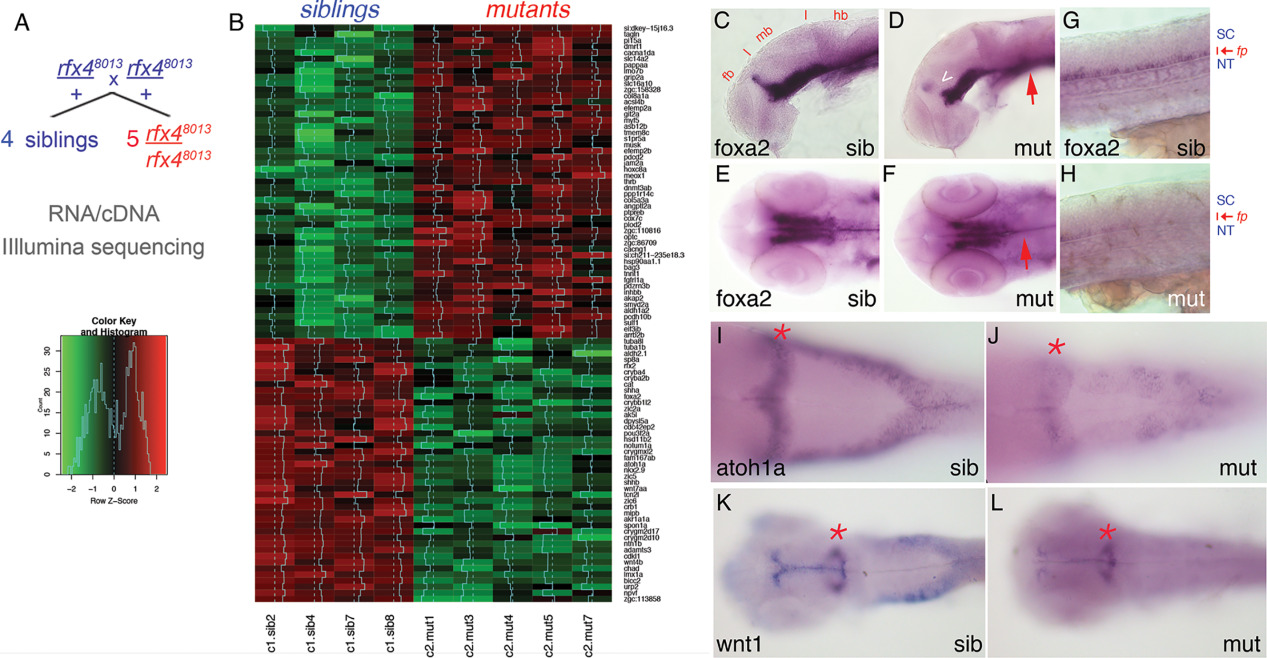
RNAseq transcriptome analysis identifies a set of Rfx4‐dependent targets in 24‐hpf zebrafish. A: Embryos derived from rfx4uw8013/+ parents were sorted by morphology into mutant and sibling groups. RNA extracted from individual embryos (4 normal and 5 curved) was used to prepare cDNA libraries for illumina high‐throughput sequencing. B: The heat‐map colors represent relative expression levels of genes identified as differentially expressed, i.e., genes assigned value of False‐Discovery Rate below 0.05. C–L: Embryos derived from rfx4uw8013/ + incrosses were stained at 1 dpf by WISH to visualize expression of foxa2 in the floor plate (C–H), atoh1a in the dorsal hindbrain (I,J) or wnt1 in the dorsal hindbrain and midbrain (K,L). C,D: foxa2 expression is disrupted in the ZLI (arrowhead) and floor plate (arrow) in mutant embryos. E,F: foxa2 expression is reduced in the medial and lateral floor plate in the mutant hindbrain (arrows). G,H: foxa2 expression is reduced in the spinal cord floor plate in mutant embryos. I,J: atoh1a expression is reduced in the mutant dorsal hindbrain. K,L: wnt1 expression is reduced in the mutant dorsal midbrain and hindbrain. Representative rfx48013 and rfx48013/+ embryos are shown dorsally, anterior to the left, except for C, D, G, H shown laterally. fb, forebrain; mb, midbrain; hb, hindbrain; sc, spinal cord; fp, floor plate; SC, spinal cord; NT, notochord; asterisk, mid‐hindbrain boundary; ZLI, zona limitans intrathalamica.