
Fig. 2
- ID
- ZDB-IMAGE-180626-14
- Genes
- Antibodies
- Publication
- Mönnich et al., 2018 - CEP128 Localizes to the Subdistal Appendages of the Mother Centriole and Regulates TGF-β/BMP Signaling at the Primary Cilium
- All Figures
- Figures for Mönnich et al., 2018
|
Fig. 2
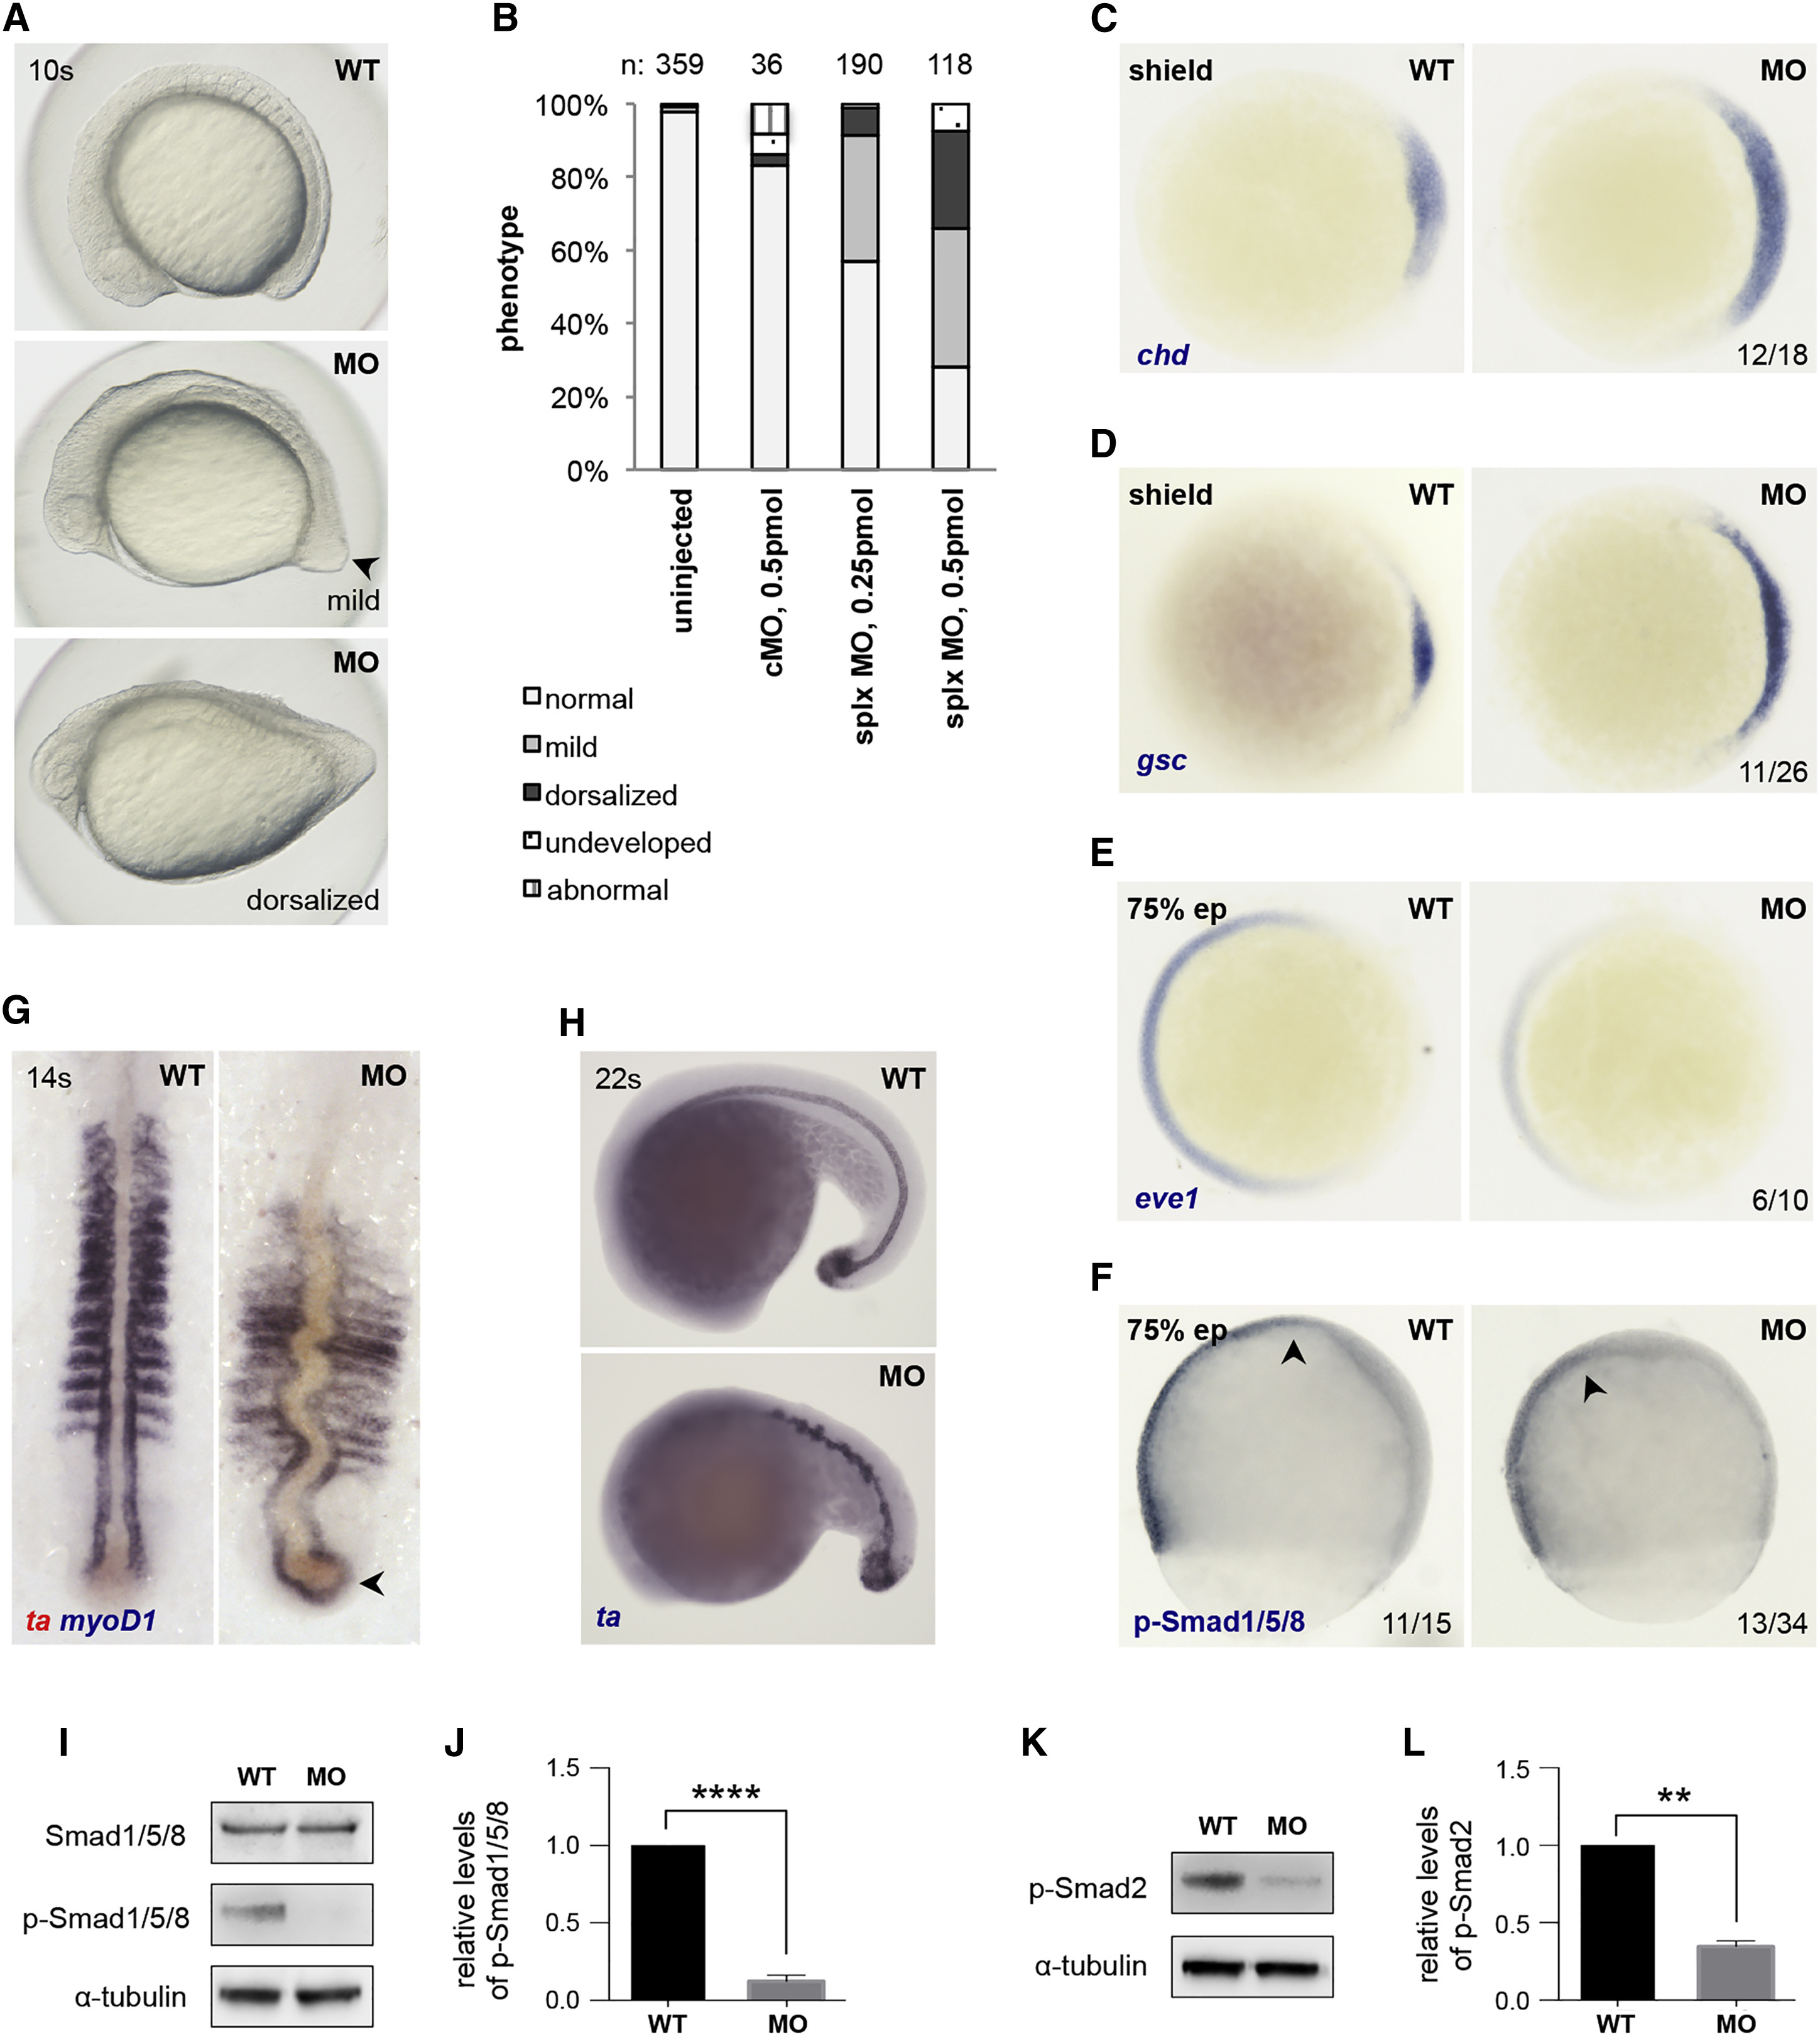
CEP128 Regulates TGF-β/BMP Signaling in Zebrafish
(A) Phenotype of cep128-depleted embryos at the 10-somite stage. Embryos show mild (note the pointy tail of the embryo, arrow) to severe (egg-shaped yolk sac) dorsalized morphology. Lateral views, anterior to left.
(B) Numbers for the phenotypic analysis in (A). Two to four independent experiments.
(C–E) Dorsoventral patterning genes are misexpressed in cep128 splx morphants. Areas of expression of dorsal genes chd (C) and gsc (D) are increased in morphants; the ventrally expressed gene eve1 (E) is slightly decreased. Animal pole views, dorsal to right.
(F) The phosphorylation level of Smad1/5/8 is slightly reduced in morphants. The thickened embryonic tissue in the morphants indicates dorsalization of the embryo (arrow). Lateral views, dorsal to right.
(G) myoD1 expression (blue) shows thin and elongated somites in morphants, with adaxial cells extending around the tail bud (arrowhead); the notochord (ta expression, red) is thickened and bent. Dorsal views, anterior to top.
(H) ta expression is ectopic and unstructured in the notochord and tailbud areas in cep128 morphants.
(I–L) WB analysis of embryos at 75% epiboly (I and K) and quantification of relative band intensities (J and L) show that phosphorylation levels of Smad1/5/8 and Smad2 are reduced significantly in morphants compared to WT. Graphs show means ± SDs (n = 3). ∗∗p ≤ 0.01; ∗∗∗∗p ≤ 0.0001.
See also Figure S3.