
Fig. 2
- ID
- ZDB-IMAGE-180515-2
- Genes
- Publication
- Gagnon et al., 2017 - The primary role of zebrafish nanog is in extra-embryonic tissue.
- All Figures
- Figures for Gagnon et al., 2017
|
Fig. 2
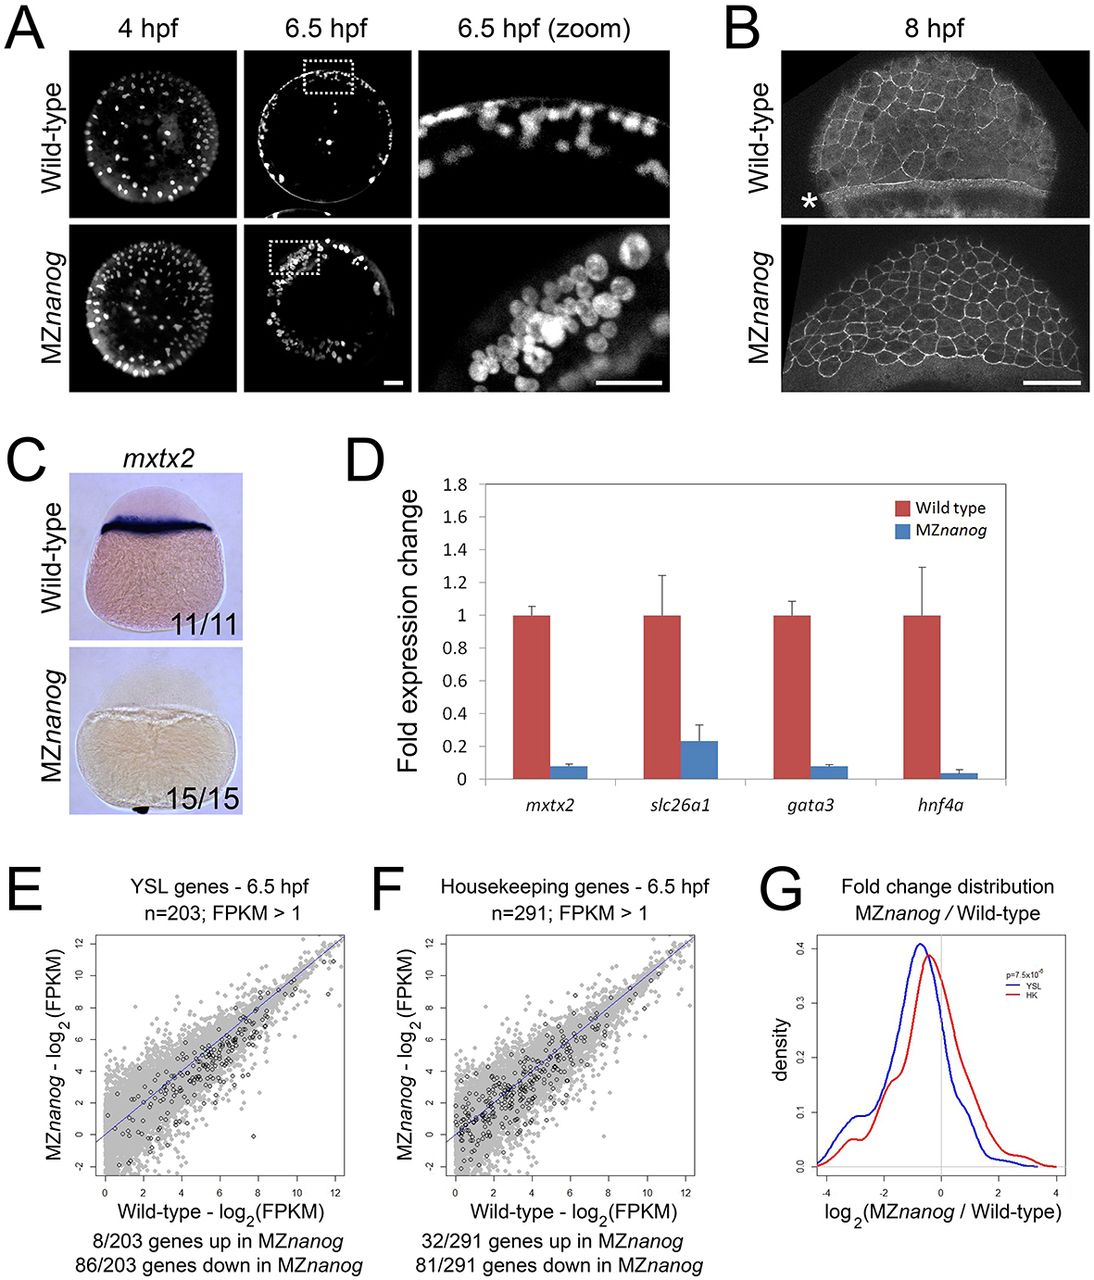
The YSL is impaired in MZnanog embryos. (A) Yolk syncytial nuclei (YSN) were labeled by SYTOX Green dye injection into the yolk of 128-cell wild-type and MZnanog embryos, and imaged at 4 hpf and 6.5 hpf; n=7 for all conditions. Images on the right are magnifications of the boxed areas to the left. (B) The F-actin band, indicated with an asterisk, was visualized using phalloidin staining in fixed wild-type and MZnanog embryos at 8 hpf; n=8 for both wild type and MZnanog. (C) In situ hybridization for mxtx2 expression in wild-type and MZnanog embryos at sphere stage. The number of embryos exhibiting the illustrated expression pattern is shown in the bottom-right corner of each image as a proportion of total embryos examined. (D) Fold expression change for mxtx2, slc26a1, gata3 and hnf4a comparing wild-type and MZnanog embryos at 4 hpf (sphere stage) using RT-qPCR. Error bars show s.d. for three technical replicates (ten embryos per replicate). (E) Differential expression of genes expressed in the YSL, comparing wild type and MZnanog at 6.5 hpf using RNAseq. All genes are in gray, YSL-expressed genes are in black and were previously defined (Xu et al., 2012), and filtered for zygotic expression (Rabani et al., 2014). (F) Differential expression of zygotically expressed housekeeping genes (Lee et al., 2013), comparing wild type and MZnanog at shield stage using RNAseq. All genes are in gray, housekeeping genes are in black. Only those genes with wild-type mRNA expression >1 fragments per kilobase of transcript per million mapped reads (FPKM) are plotted. Genes are categorized as up- or downregulated if their expression in MZnanog differs more than 2-fold from that in wild type. (G) Distribution of fold changes derived from RNAseq data comparing wild-type and MZnanog embryos for all YSL (blue) and housekeeping (HK; red) genes visualized using a kernel density estimation. The displayed P-value (P=7.5×10⁶) comparing these two sets was calculated using a Student's two-tailed t-test. Scale bars: 100 μm.