
|
Fig. 4
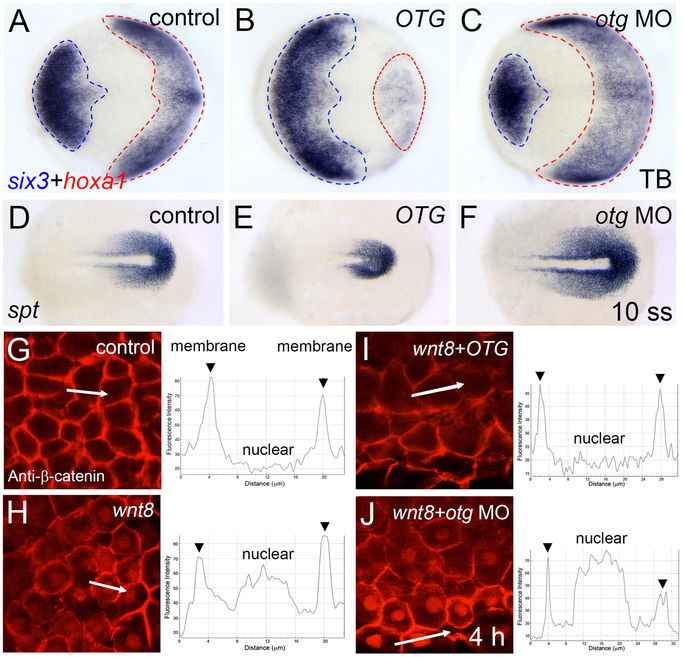
Loss of otg function affects AP-DV patterning and nuclear β-catenin localization. (A–C) Doral views, anterior to the left. Expression patterns of an anterior neural marker six3 and a posterior neural marker hoxa1 in control (A, 12/12, 100%), OTG mRNA-injected (B, 17/20, 85%) or otg MO-injected (C, 16/18, 89%) embryo at tail bud stage (10 hpf). (D–F) Doral views, posterior to the right. Expression pattern of a posterior mesoderm marker spt in control (D, 10/10, 100%), OTG mRNA-injected (E, 18/20, 90%) and otg MO-injected (F, 20/23, 87%) embryo at 10 somite stage. (G–J) Views of animal pole cells at blastula stage. Immunostaining for β-catenin and fluorescence intensity profile along the white lines in control (G), wnt8 mRNA-injected (H), wnt8 and OTG mRNA-injected (I), or wnt8 mRNA and otg MO-injected (J) embryo.