
Fig. 2
- ID
- ZDB-IMAGE-180202-8
- Genes
- Publication
- Joris et al., 2017 - Number of inadvertent RNA targets for morpholino knockdown in Danio rerio is largely underestimated: evidence from the study of Ser/Arg-rich splicing factors
- All Figures
- Figures for Joris et al., 2017
|
Fig. 2
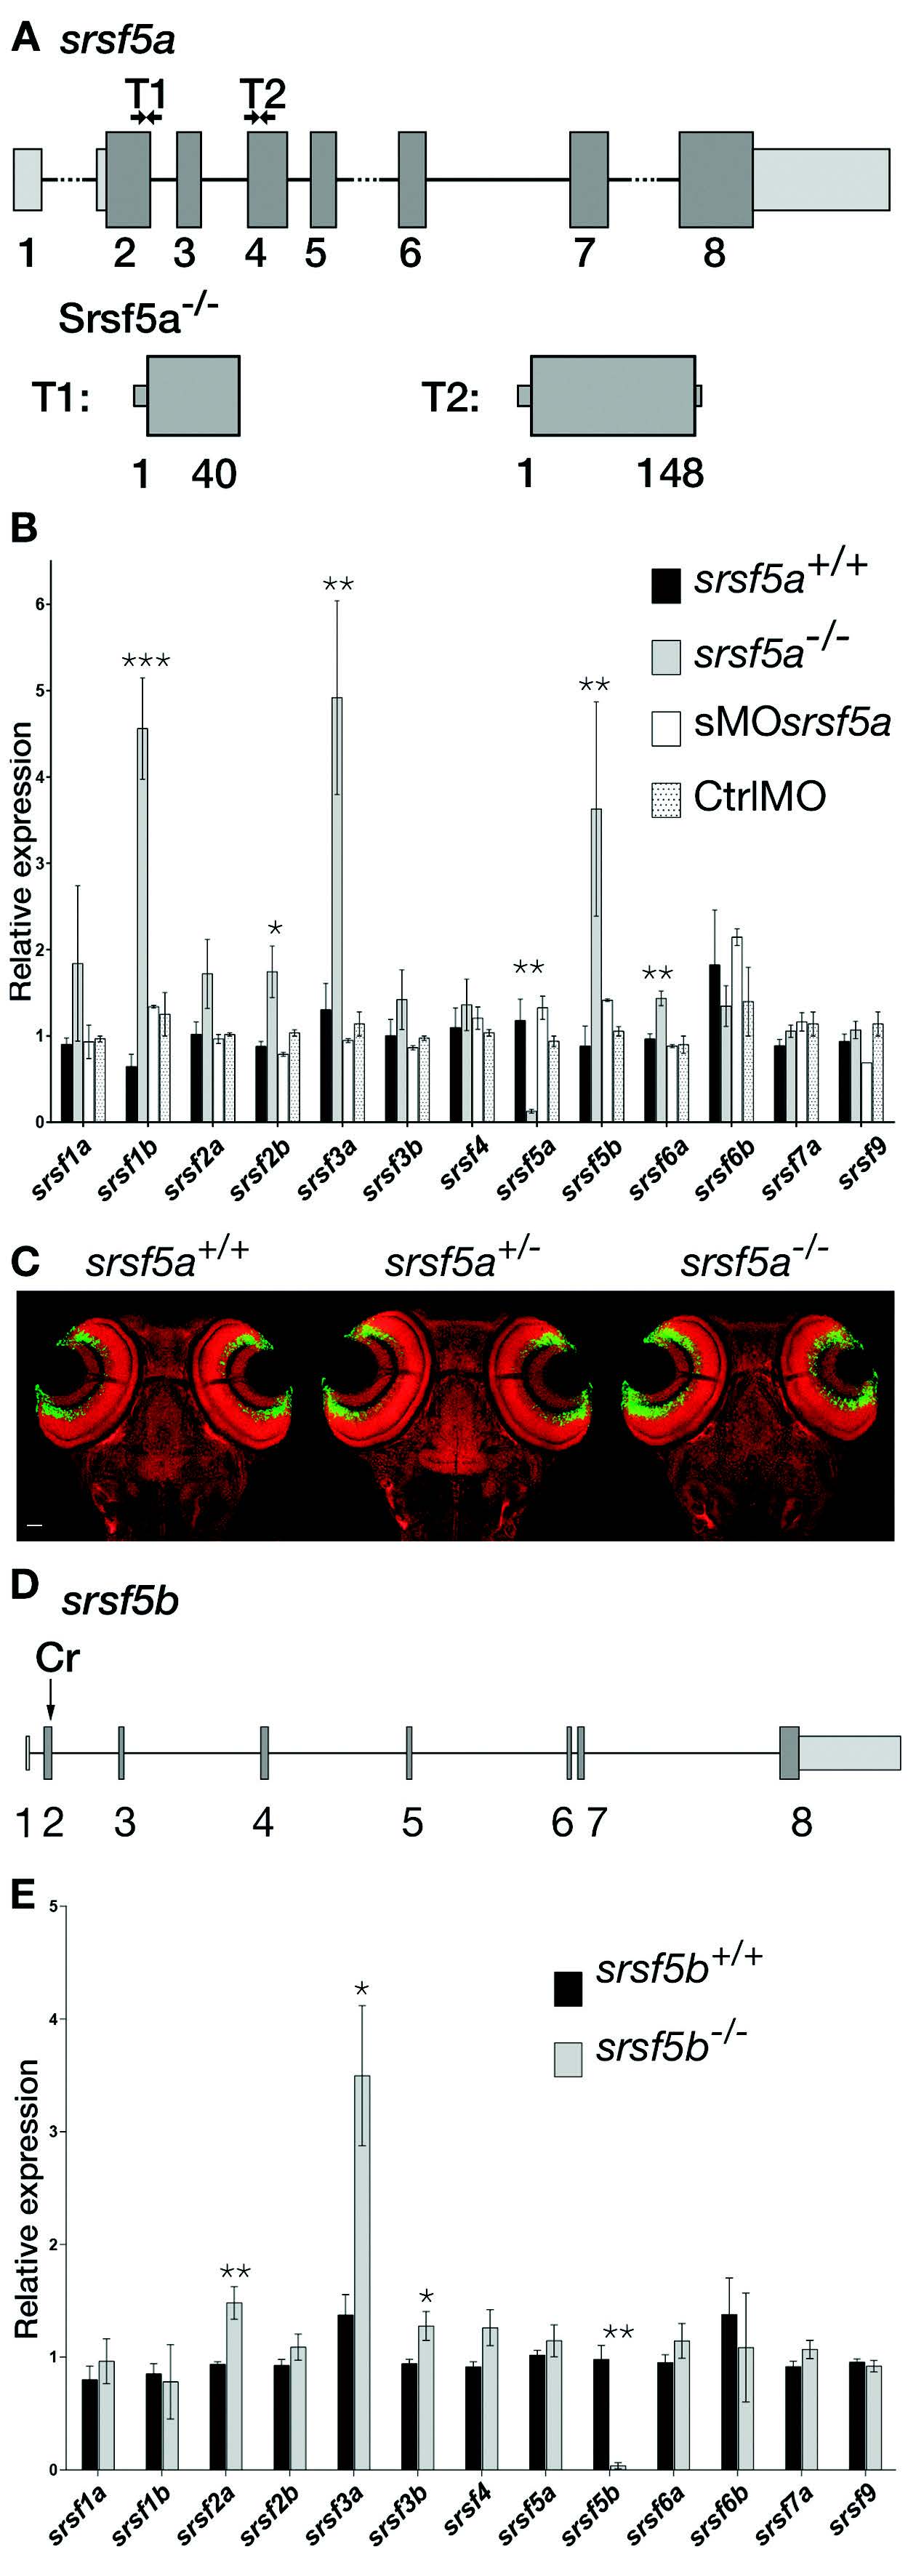
srsf5a−/−and srsf5b−/− did not show any developmental defects, but presented an overexpression of several homologous SR genes. (A) Two TALEN pairs were designed to target exon 2 or exon 4 of the srsf5a locus. TALEN pairs 1 and 2 generated of a deletion of, respectively 11 (Δ11) and 5 nt (Δ5), resulting in the production of a protein truncated in the RRM1 domain. (B) Quantitative RT-PCR to measure mRNA expression of sr genes in wild-type (wt), srsf5a mutants, morphants and ctrlMO microinjected embryos at 24 hpf. A strong decrease of srsf5a mRNA levels was observed in mutants compared to wt, suggesting the loss of Srsf5a protein in the mutant. In contrast, an upregulation of srsf1b, srsf2b, srsf3a, srsf5b and srsf6a was found. No such differences were observed in morphants compared to injected control embryos or wt. The data represent mean ± S.D. expression relative to the ef1alpha reference gene of at least three independent experiments. One-way ANOVA followed by a Tukey's multiple comparison test was used for statistical analysis. *, **, ***Mutants are statistically different from wt (*P ≤ 0.05, **P ≤ 0.01 and ***P ≤ 0.001). (C) Fluorescent in situ hybridization using a pax6b probe followed by nuclear staining using draq7® in srsf5a−/− mutants and wt. No phenotype could be detected. (D) A CRISPr (Cr) was designed to target srsf5b exon2 and allowed us to obtain three different srsf5b mutants presenting 5, 11 or 14 bases deletion. The three mutations led to the production of a truncated protein in the RRM1 domain. (E) Comparison of SR genes expression level between srsf5b homozygous mutants (including the three mutant lines) and wt embryos at 24 hpf showed an overexpression of srsf2a, srsf3a and srsf3b. A drastic decrease of srsf5b expression confirmed its depletion in mutants. All data are expressed as the mean ± SEM. A one-way ANOVA was used for statistical analysis, followed by a multiple comparison Tukey's test. *, **, *** Mutants are statistically different from wt (*P ≤ 0.05, **P ≤ 0.01).