
Fig. 4
- ID
- ZDB-IMAGE-180105-25
- Genes
- Publication
- Wu et al., 2017 - Fine-tune regulation of carboxypeptidase N1 controls vascular patterning during zebrafish development
- All Figures
- Figures for Wu et al., 2017
|
Fig. 4
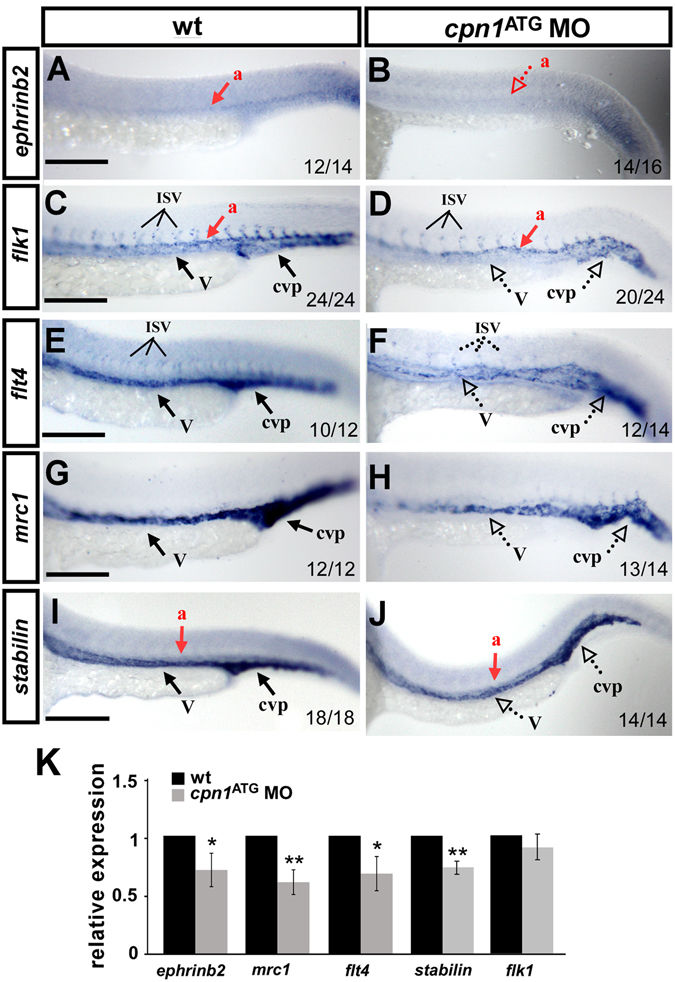
Knockdown of cpn1 modulates the expression of vascular markers. Compared with wild-type (wt) controls (A,C,E,G,I), cpn1 ATG morphants had decreased expression of the arterial marker ephrinb2 (B), venous markers mrc1 (H) and flt4 (F), and pan-vascular markers flk (D) and stabilin (J). dorsal aorta (a); vein (v); intersegmental vessels (ISV) and caudal vein plexus (cvp). The values on the bottom indicate the number of embryos exhibiting phenotype per total number of embryos analyzed from two independent experiments. (K) qPCR assay showed the relative expression level of ephrinb2 (0.71 ± 0.12), mrc1(0.61 ± 0.11), flt4 (0.69 ± 0.15), satbilin (0.74 ± 0.06) and flk1(0.9 ± 0.11) in cpn1 ATG morphants and in wt controls. qPCR data are represented as means ± S.D. **Refers to p < 0.01 and *refers to p < 0.05 according to the unpaired Student’s t-test. Scale bars are 200 µm.