
Fig. 3
- ID
- ZDB-IMAGE-170206-18
- Genes
- Publication
- Lu et al., 2017 - Tbx20 drives cardiac progenitor formation and cardiomyocyte proliferation in zebrafish
- All Figures
- Figures for Lu et al., 2017
|
Fig. 3
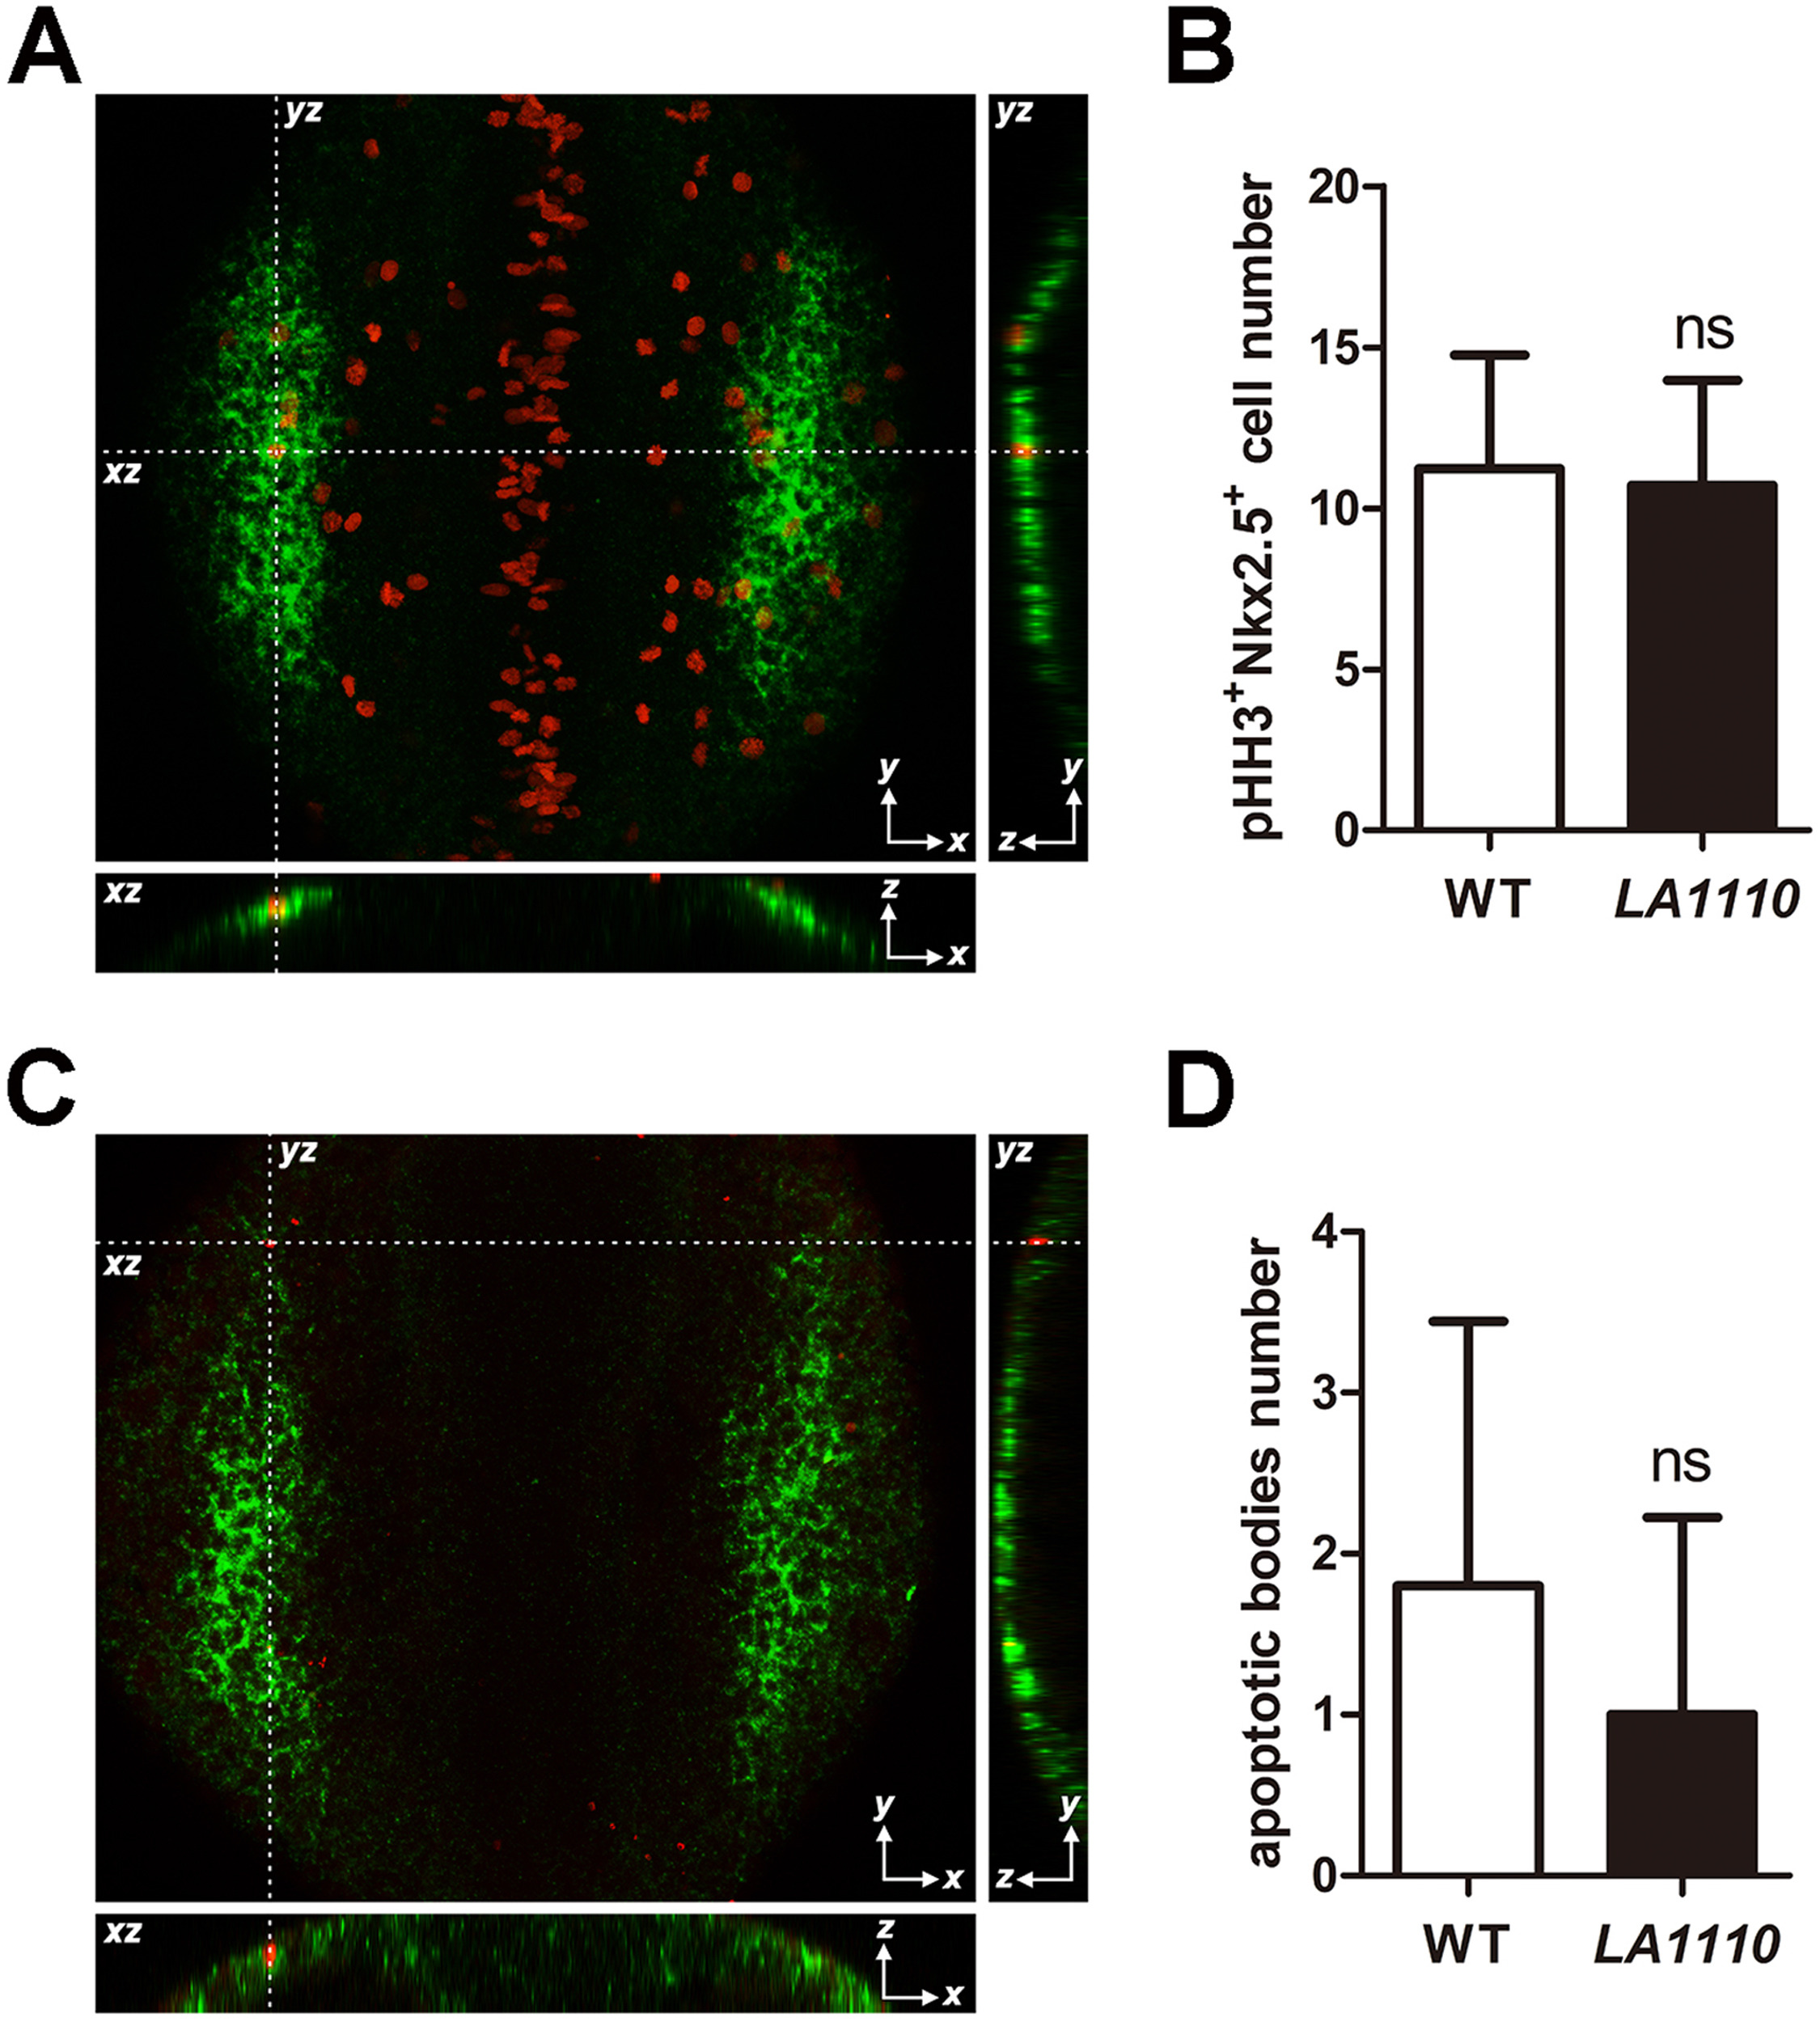
Quantification of cardiac progenitor proliferation and apoptosis in LA1110 mutants and wild type siblings. (A) Dorsal view of pHH3 immunostaining (red; nuclei) on a 10-somite stage wild type embryo. The cardiac progenitor cells are visualized by nkx2.5 fluorescent in situ hybridization (green; cytoplasmic). Orthogonal reconstructions are shown on the bottom and the right side of the image. (B) Graph of the average number of pHH3-positive cardiac progenitor cells in wild type (n=9) and LA1110 mutant embryos (n=7). (C) Dorsal view of apoptotic bodies (red) detected by TUNEL assay in a 10-somite stage wild type embryo. Cardiac progenitor cells are marked by nkx2.5 fluorescent in situ hybridization (green; cytoplasmic). Orthogonal reconstructions are shown on the bottom and the right side of the image. (D) Graph of the average number of apoptotic bodies in the cardiac progenitor region in wild type (n=5) and LA1110 mutant embryos (n=5). Error bars indicate standard deviations. ns, not significant.
Reprinted from Developmental Biology, 421(2), Lu, F., Langenbacher, A., Chen, J.N., Tbx20 drives cardiac progenitor formation and cardiomyocyte proliferation in zebrafish, 139-148, Copyright (2017) with permission from Elsevier. Full text @ Dev. Biol.