
IMAGE
Fig. 6
Image
|
Figure Caption
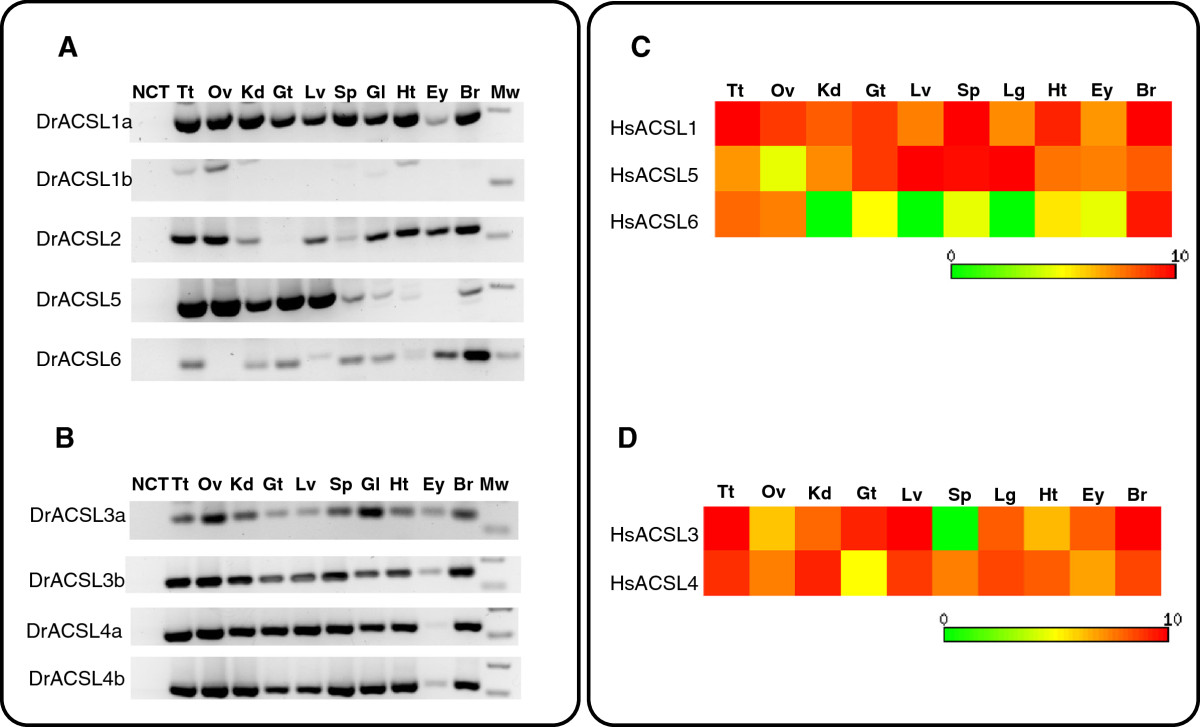
Fig. 6
Comparative expression analysis of Acsl genes in human and zebrafish tissues. (A and B) Tissue expression profile of zebrafish Acsl genes; (C and D) Tissue expression heatmap of Human Acsl genes; NCT negative template control, Tt: testis, Ov: ovary, Kd: kidney, Gt: gut, Lv: Liver, Sp: spleen, Gl: gill, Ht: heart, Ey: eye; Br: brain, Lg: lung, Mw: molecular weight marker.
Figure Data
Acknowledgments
This image is the copyrighted work of the attributed author or publisher, and
ZFIN has permission only to display this image to its users.
Additional permissions should be obtained from the applicable author or publisher of the image.
Full text @ BMC Dev. Biol.