
IMAGE
Fig. 6
- ID
- ZDB-IMAGE-161101-13
- Genes
- Publication
- Rahn et al., 2013 - Opa1 is required for proper mitochondrial metabolism in early development
- All Figures
- Figures for Rahn et al., 2013
Image
|
Figure Caption
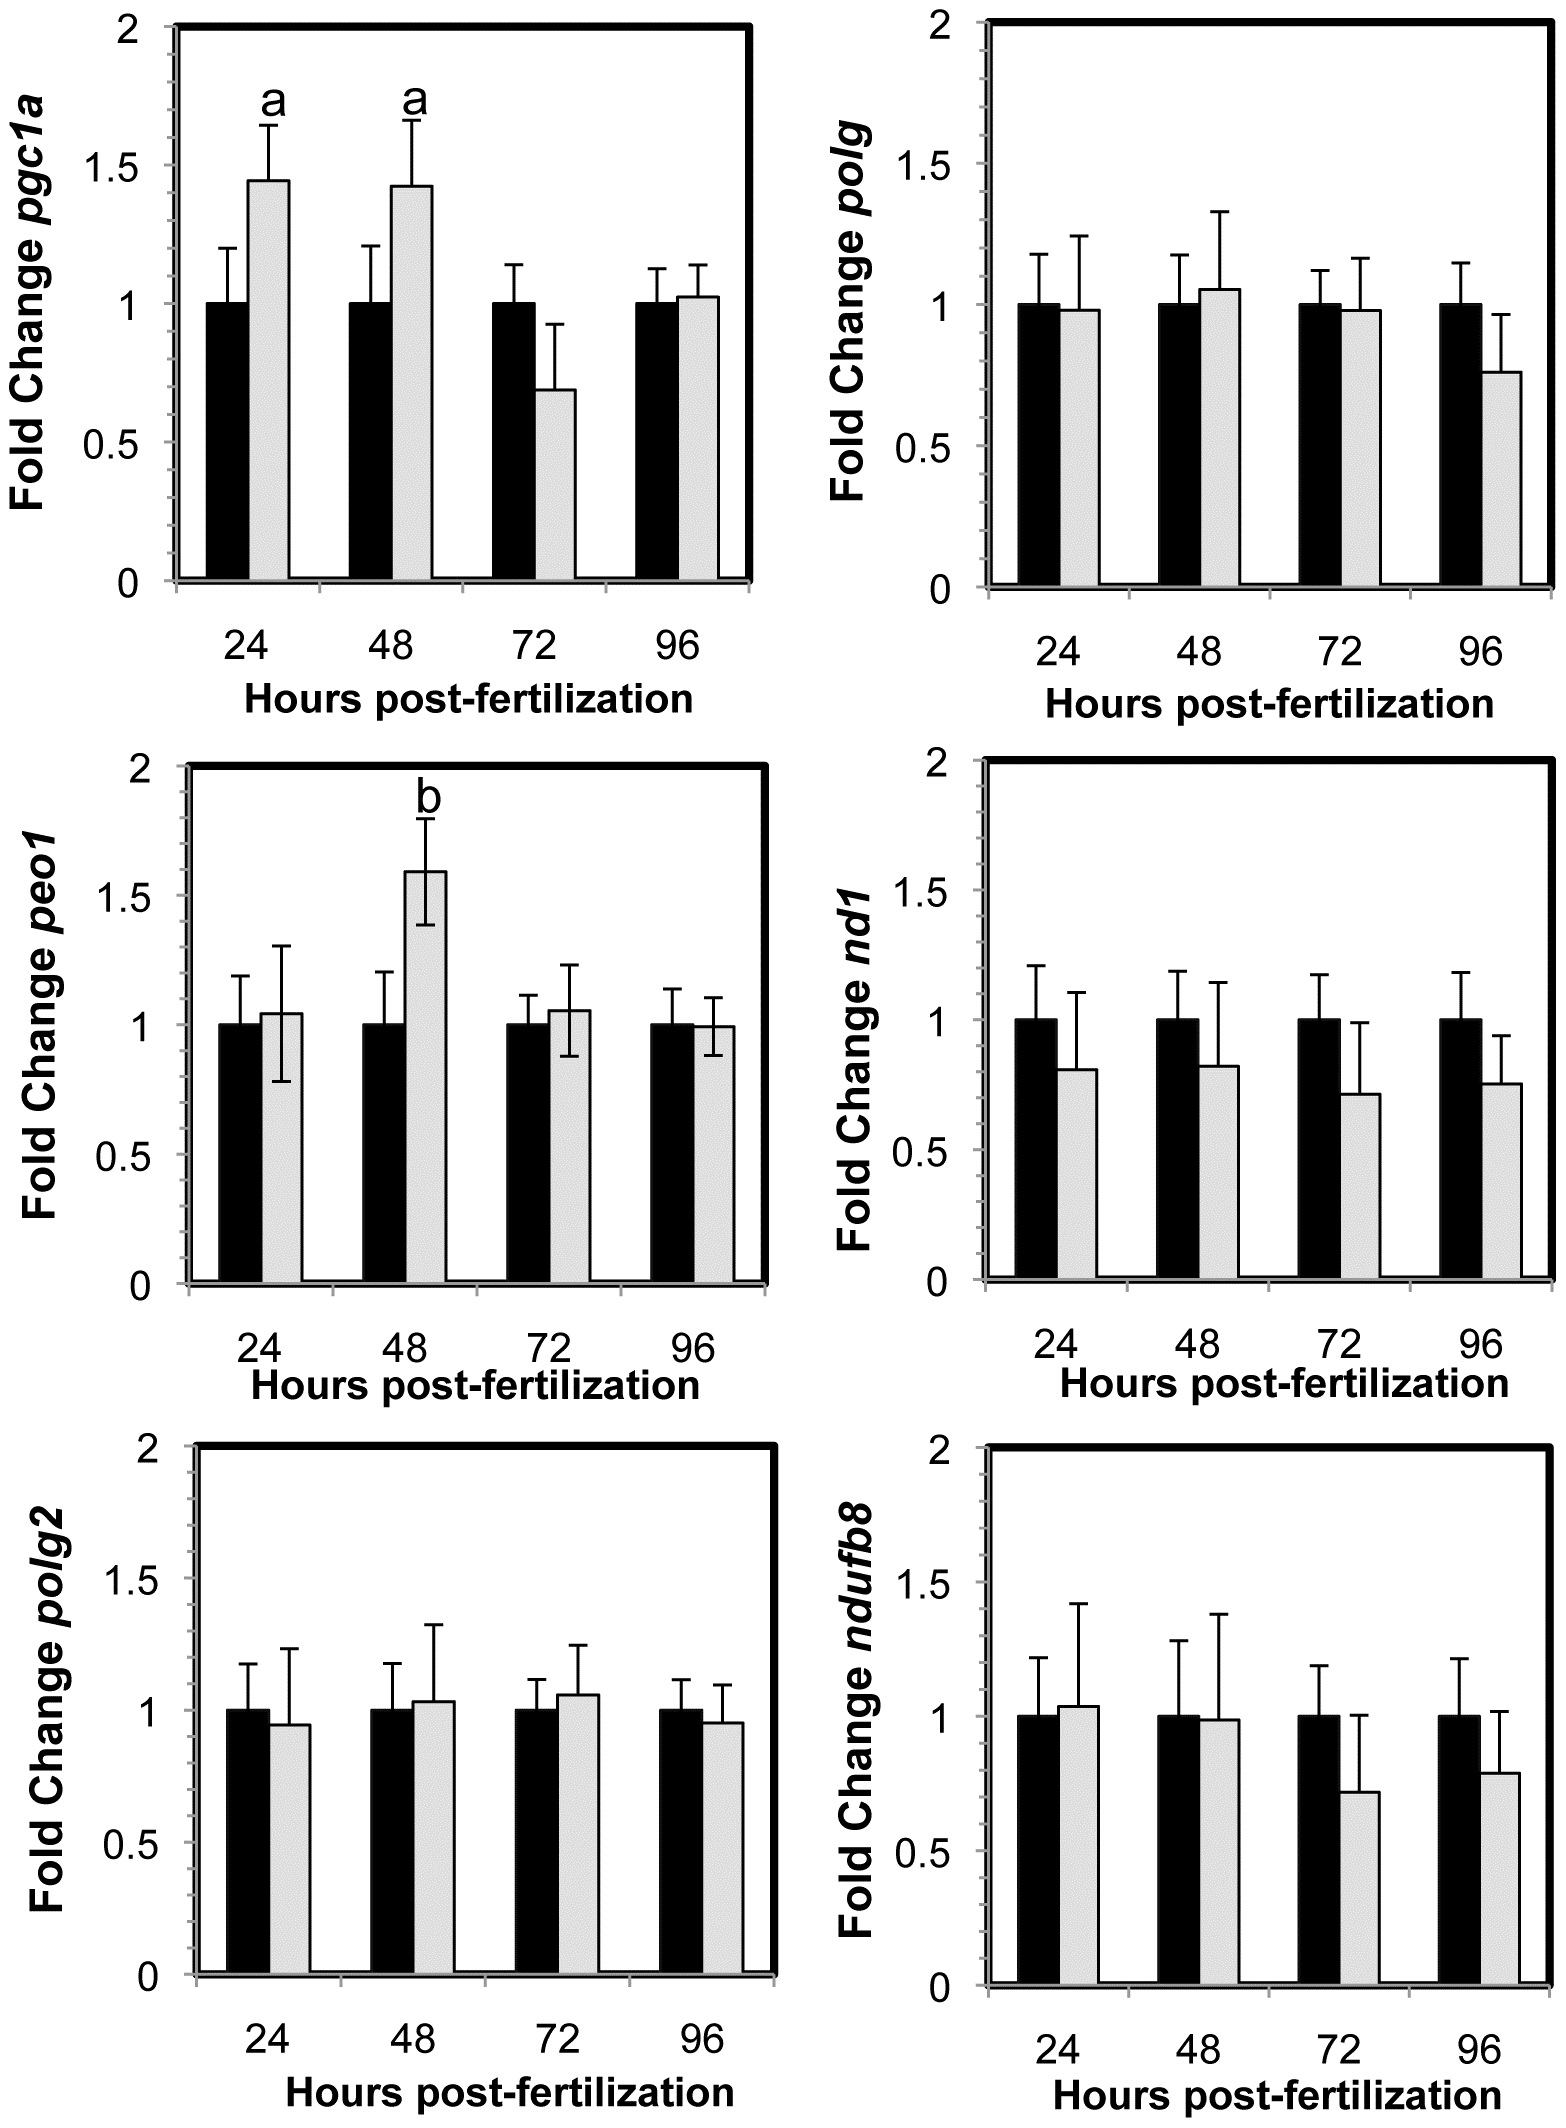
Fig. 6
Gene expression changes in MMC morphants (black) and Opa1 morphants (grey) normalized to MMC morphant levels.
Significant increases in gene expression pgc1a (a, p = 0.02) and peo1 (b, p = 0.002) were observed in opa1 morphants compared to MMC morphants. Error bars are shown +/- SEM, n = 5. P-values obtained by ANOVA.
Figure Data
Acknowledgments
This image is the copyrighted work of the attributed author or publisher, and
ZFIN has permission only to display this image to its users.
Additional permissions should be obtained from the applicable author or publisher of the image.
Full text @ PLoS One